Here, you'll find out more about the major, including such details as the number of graduates, what degree levels are offered, ethnicity of students, and more. Also, learn how Shoreline Community College ranks among other schools offering degrees in data entry.
Jump to any of the following sections:
Learn about start dates, transferring credits, availability of financial aid, and more by contacting the universities below.
AS in Information Technologies
Gain the specialized knowledge and critical-thinking skills required to begin a career in tech with this online associate degree from Southern New Hampshire University.
BA in Information Technologies
Gain a well-rounded education while preparing for a career in IT with this online bachelor's from Southern New Hampshire University.
BS in Computer Science - Data Analysis
Build structured databases, explore big data and learn how to clean data in Southern New Hampshire University's online bachelor's in computer science with a concentration in data analysis.
The data entry major at Shoreline Community College is not ranked on College Factual’s Best Colleges and Universities for Data Entry. This could be for a number of reasons, such as not having enough data on the major or school to make an accurate assessment of its quality.
In 2022-2023, the average part-time undergraduate tuition at Shoreline Community College was $211 per credit hour for out-of-state students. The average for in-state students was $111 per credit hour. The following table shows the average full-time tuition and fees for undergraduates.
| In State | Out of State | |
|---|---|---|
| Tuition | $3,648 | $6,690 |
| Fees | $740 | $740 |
| Books and Supplies | $762 | $762 |
| On Campus Room and Board | $19,422 | $19,422 |
| On Campus Other Expenses | $3,750 | $3,750 |
Learn more about Shoreline Community College tuition and fees.
Online degrees for the Shoreline Community College data entry bachelor’s degree program are not available at this time. To see if the school offers distance learning options in other areas, visit the Shoreline Community College Online Learning page.
All of the 1 students who graduated with a Associate’s in data entry from Shoreline Community College in 2022 were women.

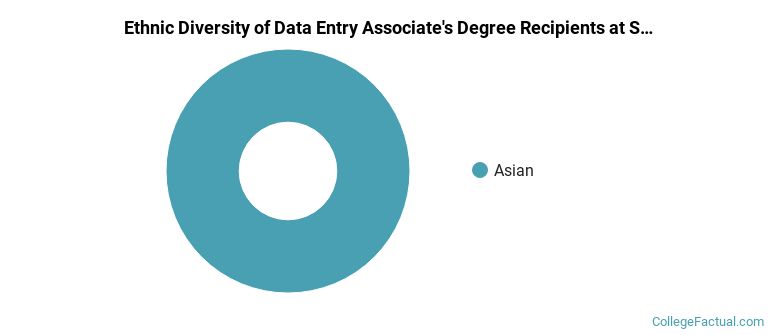
The majority of associate's degree recipients in this major at Shoreline Community College are Asian American. In the most recent graduating class for for which data is available, 100% of students fell into this category.
The following table and chart show the ethnic background for students who recently graduated from Shoreline Community College with a associate's in data entry.
| Ethnic Background | Number of Students |
|---|---|
| Asian | 1 |
| Black or African American | 0 |
| Hispanic or Latino | 0 |
| White | 0 |
| Non-Resident Aliens | 0 |
| Other Races | 0 |
| Related Major | Annual Graduates |
|---|---|
| Computer Science | 3 |
