We've gathered data and other essential information about the program, such as the average salary of graduates, ethnicity of students, how many students graduated in recent times, and more. In addition, we cover how SIUE ranks in comparison to other schools with geography programs.
Go directly to any of the following sections:
The bachelor's program at SIUE was ranked #105 on College Factual's Best Schools for geography list. It is also ranked #5 in Illinois.
During the 2021-2022 academic year, Southern Illinois University Edwardsville handed out 23 bachelor's degrees in geography & cartography. Last year, the same number of degrees were handed out.
In 2022, 3 students received their master’s degree in geography from SIUE. This makes it the #92 most popular school for geography master’s degree candidates in the country.
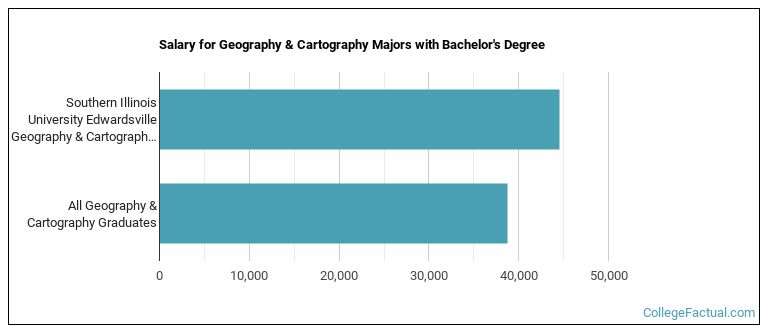
Geography majors who earn their bachelor's degree from SIUE go on to jobs where they make a median salary of $44,543 a year. This is great news for graduates of the program, since this figure is higher than the national average of $38,726 for all geography bachelor's degree recipients.
In 2022-2023, the average part-time undergraduate tuition at SIUE was $308 per credit hour for both in-state and out-of-state students. Information about average full-time undergraduate tuition and fees is shown in the table below.
| In State | Out of State | |
|---|---|---|
| Tuition | $8,846 | $8,846 |
| Fees | $3,179 | $3,179 |
| Books and Supplies | $980 | $980 |
| On Campus Room and Board | $10,562 | $10,562 |
| On Campus Other Expenses | $5,782 | $5,782 |
Learn more about SIUE tuition and fees.
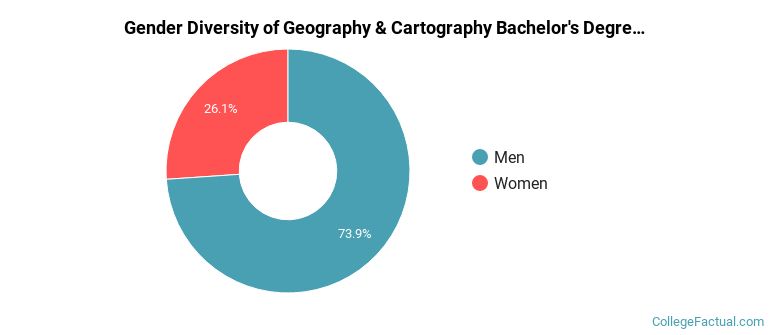
Of the 23 students who earned a bachelor's degree in Geography & Cartography from SIUE in 2021-2022, 74% were men and 26% were women.
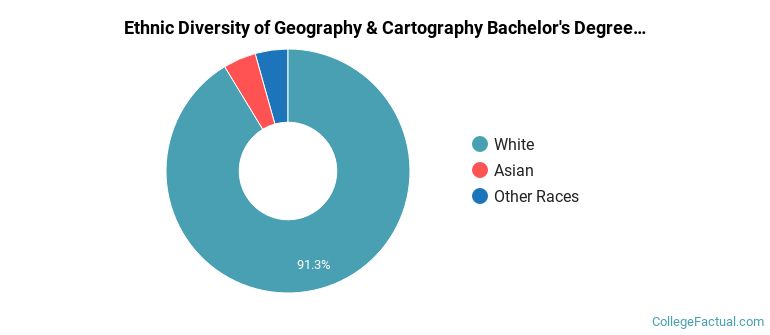
The majority of the students with this major are white. About 91% of 2022 graduates were in this category.
The following table and chart show the ethnic background for students who recently graduated from Southern Illinois University Edwardsville with a bachelor's in geography.
| Ethnic Background | Number of Students |
|---|---|
| Asian | 1 |
| Black or African American | 0 |
| Hispanic or Latino | 0 |
| White | 21 |
| Non-Resident Aliens | 0 |
| Other Races | 1 |
Online degrees for the SIUE geography bachelor’s degree program are not available at this time. To see if the school offers distance learning options in other areas, visit the SIUE Online Learning page.
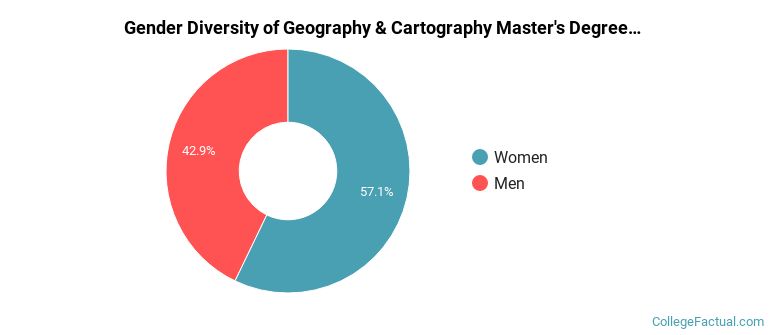
In the 2021-2022 academic year, 7 students earned a master's degree in geography from SIUE. About 57% of these graduates were women and the other 43% were men.
The majority of the students with this major are white. About 71% of 2022 graduates were in this category.
The following table and chart show the ethnic background for students who recently graduated from Southern Illinois University Edwardsville with a master's in geography.
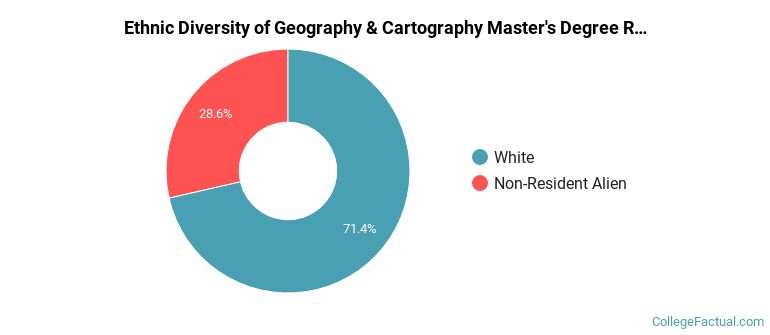
| Ethnic Background | Number of Students |
|---|---|
| Asian | 0 |
| Black or African American | 0 |
| Hispanic or Latino | 0 |
| White | 5 |
| Non-Resident Aliens | 2 |
| Other Races | 0 |
Take a look at the following statistics related to the make-up of the geography majors at Southern Illinois University Edwardsville.
| Related Major | Annual Graduates |
|---|---|
| Political Science & Government | 29 |
| Sociology | 26 |
| Anthropology | 19 |
| Economics | 5 |
More about our data sources and methodologies.