Go directly to any of the following sections:
The personal & culinary services major at SWIC is not ranked on College Factual’s Best Colleges and Universities for Personal & Culinary Services. This could be for a number of reasons, such as not having enough data on the major or school to make an accurate assessment of its quality.
During the 2022-2023 academic year, part-time undergraduate students at SWIC paid an average of $198 per credit hour if they came to the school from out-of-state. In-state students paid a discounted rate of $204 per credit hour. The average full-time tuition and fees for undergraduates are shown in the table below.
| In State | Out of State | |
|---|---|---|
| Tuition | $6,120 | $5,940 |
| Fees | $270 | $270 |
| Books and Supplies | $2,400 | $2,400 |
Learn more about SWIC tuition and fees.
Online degrees for the SWIC personal & culinary services bachelor’s degree program are not available at this time. To see if the school offers distance learning options in other areas, visit the SWIC Online Learning page.
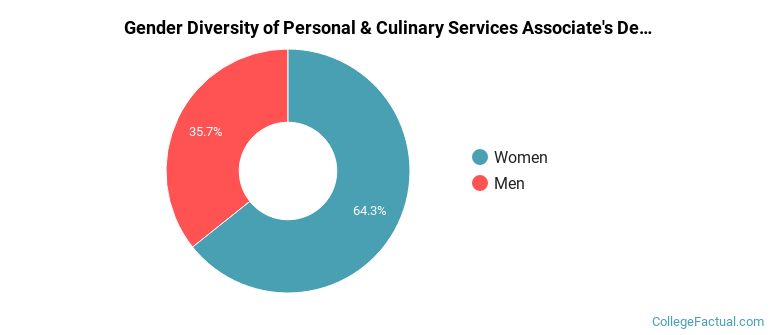
During the 2021-2022 academic year, 14 students graduated with a associate's degree in personal & culinary services from SWIC. About 36% were men and 64% were women.
The majority of the students with this major are white. About 57% of 2022 graduates were in this category.
The following table and chart show the ethnic background for students who recently graduated from Southwestern Illinois College with a associate's in personal & culinary services.
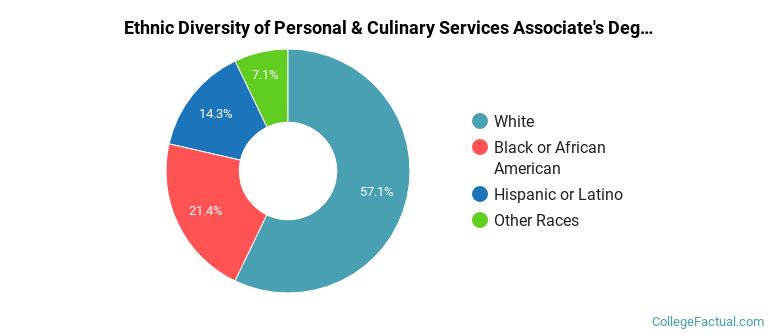
| Ethnic Background | Number of Students |
|---|---|
| Asian | 0 |
| Black or African American | 3 |
| Hispanic or Latino | 2 |
| White | 8 |
| Non-Resident Aliens | 0 |
| Other Races | 1 |
Personal & Culinary Services students may decide to major in one of the following focus areas. Individual majors may not be available for all degree levels.
| Major | Annual Graduates |
|---|---|
| Culinary Arts | 26 |
| Related Major | Annual Graduates |
|---|---|
| Precision Production | 279 |
| Mechanic & Repair Technologies | 208 |
| Construction Trades | 62 |
| Transportation & Materials Moving | 14 |