Here is an overview of this program at St. Kate’s. Degrees are awarded at the Bachelor’s, Certificate levels, with graduate study also available. Jump to any of the following sections:
The following degree levels are granted in teacher education subject specific at St. Kate’s, along with how many graduates complete each level annually.
| Degree Level | Annual Graduates |
|---|---|
| Bachelor’s | 2 |
| Certificate | 18 |
| Master’s | 4 |
| Graduate Certificate | 1 |
In the most recent year for which we have data, St Catherine University conferred 2 bachelor’s degrees in teacher education subject specific.
St. Kate’s has not been ranked for teacher education subject specific at the bachelor’s level.
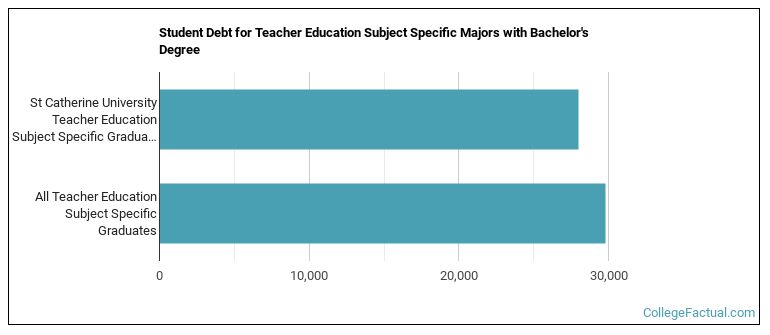
Earning a bachelor’s degree at St. Kate’s, teacher education subject specific students borrow a median amount of $28,000 in student loans. This is below $29,785, the typical median for all majors at St. Kate’s.
The full-time undergraduate tuition and fees are shown below.
| In State | Out of State | |
|---|---|---|
| Tuition | $45,600 | $37,534 |
| Fees | $894 | $894 |
Learn more about St. Kate’s tuition and fees.
All of the 2 students who graduated with a bachelor’s degree in teacher education subject specific from St. Kate’s identified as women.
 The majority of teacher education subject specific bachelor’s degree graduates at St. Kate’s are White. Roughly 100% of graduates fell into this category.
The following table and chart show the ethnic background for students who recently graduated from St Catherine University with a bachelor’s in teacher education subject specific.

| Ethnic Background | Number of Students |
|---|---|
| Asian | 0 |
| Black or African American | 0 |
| Hispanic or Latino | 0 |
| White | 2 |
| Non-Resident Aliens | 0 |
| Other Races | 0 |
St. Kate’s granted 1 bachelor’s degree in english/language arts teacher education in the latest year of data — 100% to women and 0% to men. The largest share of these graduates were White (100%).
St. Kate’s conferred 1 bachelor’s completion in german language teacher education in the latest year of data — 100% to women and 0% to men. The most common background among these graduates was White (100%).
In the most recent year for which we have data, St Catherine University awarded 18 certificate degrees in teacher education subject specific.
St. Kate’s has not been ranked for teacher education subject specific at the certificate level.
Among recent graduates, 6% of teacher education subject specific certificate degrees went to men and 94% went to women.
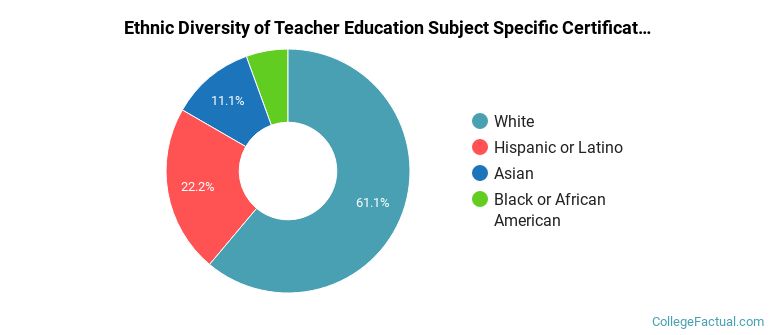
 The majority of teacher education subject specific certificate degree graduates at St. Kate’s were White. Roughly 61% of graduates fell into this category.
The following table and chart show the ethnic background for students who recently graduated from St Catherine University with a certificate in teacher education subject specific.
| Ethnic Background | Number of Students |
|---|---|
| Asian | 2 |
| Black or African American | 1 |
| Hispanic or Latino | 4 |
| White | 11 |
| Non-Resident Aliens | 0 |
| Other Races | 0 |
St. Kate’s granted 18 certificate degrees in science teacher education/general science teacher education in the latest year of data — 94% to women and 6% to men. The most common background among these graduates was White (61%).
This program is also offered at the graduate level at St. Kate’s. Annual graduate completions by level are shown below.
| Graduate Level | Annual Graduates |
|---|---|
| Master’s Degrees in Teacher Education Subject Specific | 4 |
| Graduate Certificate Degrees in Teacher Education Subject Specific | 1 |