Explore the best ranked schools for the programs you are most interested in.
Strayer University - North Carolina was not ranked in College Factual's Best Overall Colleges report this year. This may be because not enough data was available.
See all of the rankings for Strayer University - North Carolina.
Since Strayer University - North Carolina has an open admissions policy, being accepted to the school isn't that hard. However, a full basic things - such as a high school diploma or equivalent - may be required. Also, go over your application to make sure it is complete before you submit it.
At Strayer University - North Carolina, the student to faculty ratio is 41 to 1. Compared to the national average of 15 to 1, this is somewhat high. This could mean that class sizes may be larger than they are at other colleges or universities or that professors may be required to teach more classes.
In addition to the student to faculty ratio, some people look at what percentage of faculty members are full-time as a sign of how much time professors will be able to spend with their students. This is because part-time teachers may not be be on campus as much as their full-time counterparts.
The full-time faculty percentage at Strayer University - North Carolina is 22%. This is lower than the national average of 47%.
The freshmen retention rate is a sign of how many full-time students like a college or university well enough to come back for their sophomore year. At Strayer University - North Carolina this rate is 50%, which is a bit lower than the national average of 68%.
During the 2017-2018 academic year, there were 4,684 undergraduates at Strayer University - North Carolina with 202 being full-time and 4,482 being part-time.
The net price is calculated by adding tuition, room, board and other costs and subtracting financial aid.Note that the net price is typically less than the published for a school. For more information on the sticker price of Strayer University - North Carolina, see our tuition and fees and room and board pages.
Almost 66% of college students who graduated with the class of 2018 took out student loans, but that percentage varies from school to school. At Strayer University - North Carolina, approximately 100% of students took out student loans averaging $4,878 a year. That adds up to $19,512 over four years for those students.
Get more details about paying for Strayer University - North Carolina.
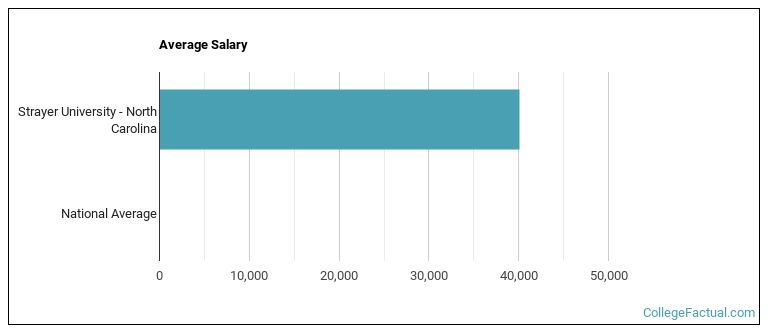
See which majors at Strayer University - North Carolina make the most money.
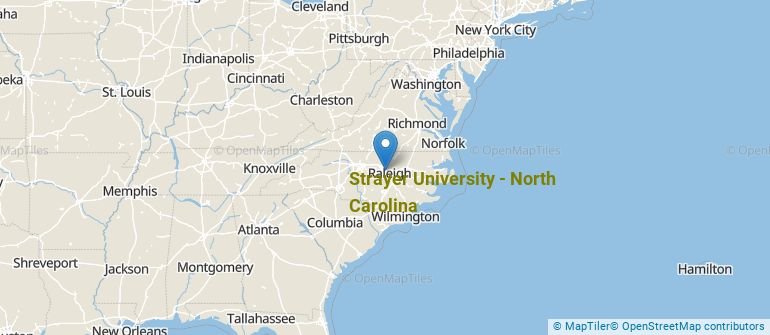
Get more details about the location of Strayer University - North Carolina.
Contact details for Strayer University - North Carolina are given below.
| Contact Details | |
|---|---|
| Address: | 4900 Koger Boulevard Suite 400, Greensboro, NC 27407-2638 |
| Phone: | 877-445-7180 |
| Website: | www.strayer.edu/campus-locations/north-carolina/greensboro |
| Most Popular Majors | Bachelor’s Degrees | Average Salary of Graduates |
|---|---|---|
| Business Administration & Management | 71 | NA |
| Criminal Justice & Corrections | 44 | $43,405 |
| Information Science | 42 | $71,167 |
| Accounting | 36 | $52,373 |
| Public Administration | 31 | NA |
| Human Resource Management | 29 | NA |
| Health & Medical Administrative Services | 24 | NA |
| Entrepreneurial Studies | 16 | NA |
| Educational Administration | 15 | NA |
| Information Technology | 4 | NA |
Online learning options are becoming more and more popular at American colleges and universities. Online classes are great for students who have busy schedules or for those who just want to study on their own time.
In 2022-2023, 3,074 students took at least one online class at Strayer University - North Carolina. This is a decrease from the 3,536 students who took online classes the previous year.
| Year | Took at Least One Online Class | Took All Classes Online |
|---|---|---|
| 2022-2023 | 3,074 | 3,074 |
| 2021-2022 | 3,536 | 3,536 |
| 2020-2021 | 5,441 | 5,441 |
| 2018-2019 | 5,636 | 5,314 |
Learn more about online learning at Strayer University - North Carolina.
Footnotes
*The racial-ethnic minorities count is calculated by taking the total number of students and subtracting white students, international students, and students whose race/ethnicity was unknown. This number is then divided by the total number of students at the school to obtain the racial-ethnic minorities percentage.
References
More about our data sources and methodologies.