Go directly to any of the following sections:
The parks & rec major at SUNY Sullivan is not ranked on College Factual’s Best Colleges and Universities for Parks, Recreation, Leisure, & Fitness Studies. This could be for a number of reasons, such as not having enough data on the major or school to make an accurate assessment of its quality.
Out-of-state part-time undergraduates at SUNY Sullivan paid an average of $456 per credit hour in 2022-2023. The average for in-state students was $228 per credit hour. The following table shows the average full-time tuition and fees for undergraduates.
| In State | Out of State | |
|---|---|---|
| Tuition | $5,472 | $10,944 |
| Fees | $817 | $817 |
| Books and Supplies | $1,000 | $1,000 |
| On Campus Room and Board | $12,000 | $12,000 |
| On Campus Other Expenses | $2,000 | $2,000 |
Learn more about SUNY Sullivan tuition and fees.
Online degrees for the SUNY Sullivan parks & rec bachelor’s degree program are not available at this time. To see if the school offers distance learning options in other areas, visit the SUNY Sullivan Online Learning page.
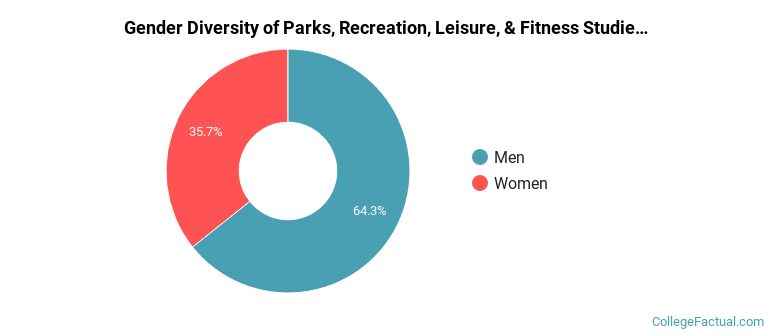
Of the 14 students who earned an associate's degree in Parks, Recreation, Leisure, & Fitness Studies from SUNY Sullivan in 2021-2022, 64% were men and 36% were women.
The following table and chart show the ethnic background for students who recently graduated from Sullivan County Community College with a associate's in parks & rec.
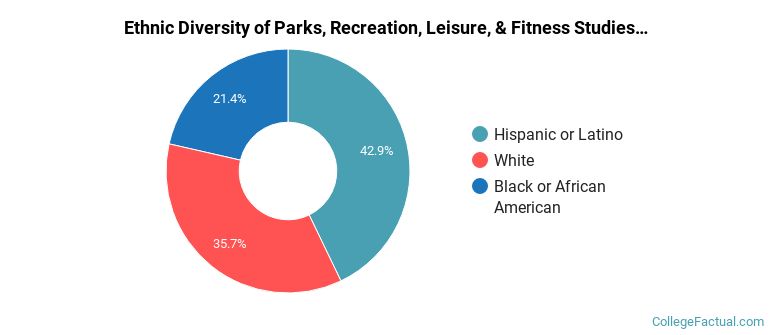
| Ethnic Background | Number of Students |
|---|---|
| Asian | 0 |
| Black or African American | 3 |
| Hispanic or Latino | 6 |
| White | 5 |
| Non-Resident Aliens | 0 |
| Other Races | 0 |
Parks, Recreation, Leisure, & Fitness Studies students may decide to major in one of the following focus areas. Individual majors may not be available for all degree levels.
| Major | Annual Graduates |
|---|---|
| Parks, Recreation & Leisure Studies | 7 |
| Recreation Administration | 5 |
| Health & Physical Education | 2 |
| Related Major | Annual Graduates |
|---|---|
| Public Administration & Social Service | 1 |
View All Parks, Recreation, Leisure, & Fitness Studies Related Majors >