We've pulled together some essential information you should know about the program, including how many students graduate each year, the ethnic diversity of these students, average starting salaries, and more. We've also included details on how Binghamton University ranks compared to other colleges offering a major in bio engineering.
Go directly to any of the following sections:
The bachelor's program at Binghamton University was ranked #92 on College Factual's Best Schools for bio engineering list. It is also ranked #9 in New York.
During the 2021-2022 academic year, Binghamton University handed out 57 bachelor's degrees in biomedical engineering. This is a decrease of 17% over the previous year when 69 degrees were handed out.
In 2022, 33 students received their master’s degree in bio engineering from Binghamton University. This makes it the #27 most popular school for bio engineering master’s degree candidates in the country.
In addition, 7 students received their doctoral degrees in bio engineering in 2022, making the school the #54 most popular school in the United States for this category of students.
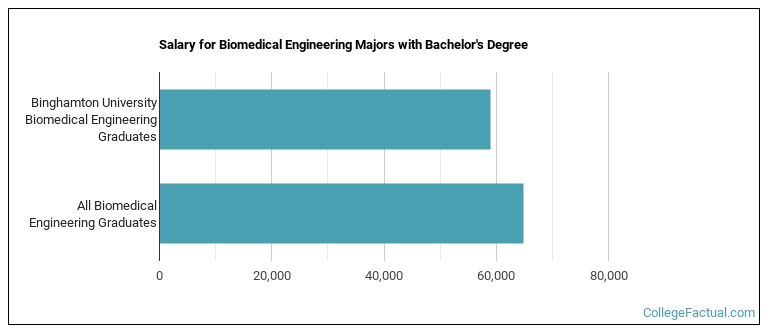
Bio Engineering majors who earn their bachelor's degree from Binghamton University go on to jobs where they make a median salary of $58,999 a year. Unfortunately, this is lower than the national average of $64,853 for all bio engineering students.
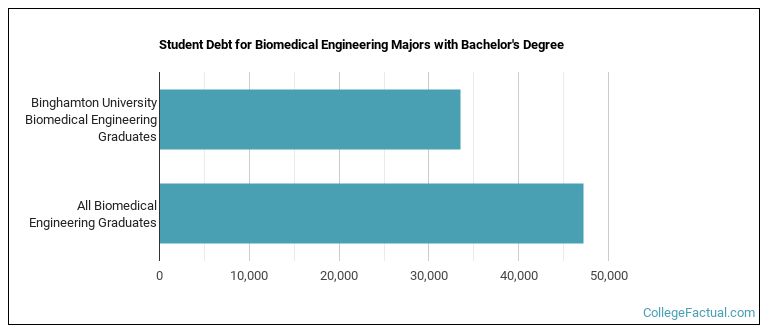
While getting their bachelor's degree at Binghamton University, bio engineering students borrow a median amount of $33,493 in student loans. This is not too bad considering that the median debt load of all bio engineering bachelor's degree recipients across the country is $47,261.
Out-of-state part-time undergraduates at Binghamton University paid an average of $1,090 per credit hour in 2022-2023. The average for in-state students was $295 per credit hour. The average full-time tuition and fees for undergraduates are shown in the table below.
| In State | Out of State | |
|---|---|---|
| Tuition | $7,070 | $26,160 |
| Fees | $3,293 | $3,293 |
| Books and Supplies | $1,000 | $1,000 |
| On Campus Room and Board | $18,294 | $18,294 |
| On Campus Other Expenses | $1,000 | $1,000 |
Learn more about Binghamton University tuition and fees.
In the 2021-2022 academic year, 57 students earned a bachelor's degree in bio engineering from Binghamton University. About 46% of these graduates were women and the other 54% were men.

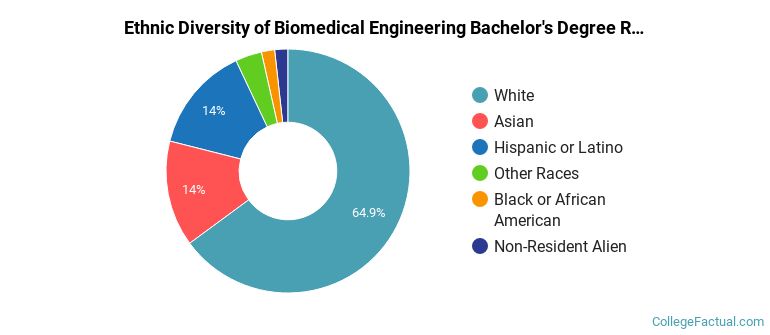
The majority of bachelor's degree recipients in this major at Binghamton University are white. In the most recent graduating class for which data is available, 65% of students fell into this category.
The following table and chart show the ethnic background for students who recently graduated from Binghamton University with a bachelor's in bio engineering.
| Ethnic Background | Number of Students |
|---|---|
| Asian | 8 |
| Black or African American | 1 |
| Hispanic or Latino | 8 |
| White | 37 |
| Non-Resident Aliens | 1 |
| Other Races | 2 |
Online degrees for the Binghamton University bio engineering bachelor’s degree program are not available at this time. To see if the school offers distance learning options in other areas, visit the Binghamton University Online Learning page.
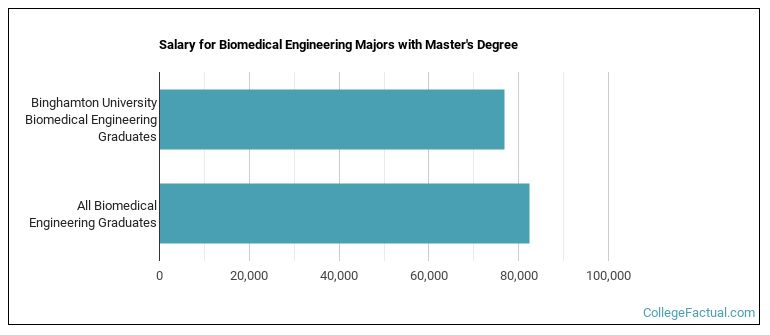
Graduates of the master's bio engineering program at Binghamton University make a median salary of $76,948. This is less than what their typical peers from other schools make. Their median salary is $82,315.
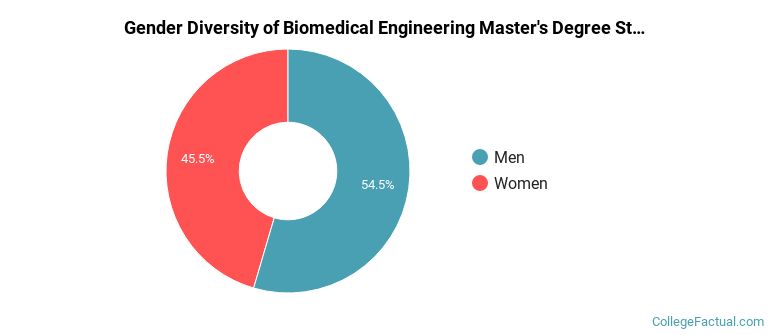
Of the 33 students who earned a master's degree in Biomedical Engineering from Binghamton University in 2021-2022, 55% were men and 45% were women.
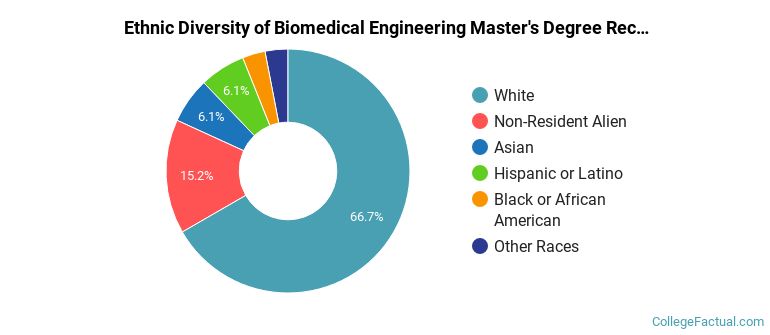
The majority of master's degree recipients in this major at Binghamton University are white. In the most recent graduating class for which data is available, 67% of students fell into this category.
The following table and chart show the ethnic background for students who recently graduated from Binghamton University with a master's in bio engineering.
| Ethnic Background | Number of Students |
|---|---|
| Asian | 2 |
| Black or African American | 1 |
| Hispanic or Latino | 2 |
| White | 22 |
| Non-Resident Aliens | 5 |
| Other Races | 1 |
Take a look at the following statistics related to the make-up of the bio engineering majors at Binghamton University.
| Related Major | Annual Graduates |
|---|---|
| Mechanical Engineering | 139 |
| Industrial Engineering | 139 |
| Electrical and Computer Engineering. | 77 |
| Computer Engineering | 51 |
| Electrical Engineering | 38 |
More about our data sources and methodologies.