Here, you'll find out more about the major, including such details as the number of graduates, what degree levels are offered, ethnicity of students, average salaries, and more. We've also included details on how SUNY Cobleskill ranks compared to other colleges offering a major in animal science.
Jump to any of the following sections:
The bachelor's program at SUNY Cobleskill was ranked #42 on College Factual's Best Schools for animal science list. It is also ranked #2 in New York.
| Ranking Type | Rank |
|---|---|
| Best Animal Science Associate Degree Schools | 6 |
| Best Animal Science Bachelor’s Degree Schools | 38 |
| Best Animal Science Schools | 42 |
During the 2021-2022 academic year, SUNY Cobleskill handed out 66 bachelor's degrees in animal science. This is a decrease of 20% over the previous year when 82 degrees were handed out.
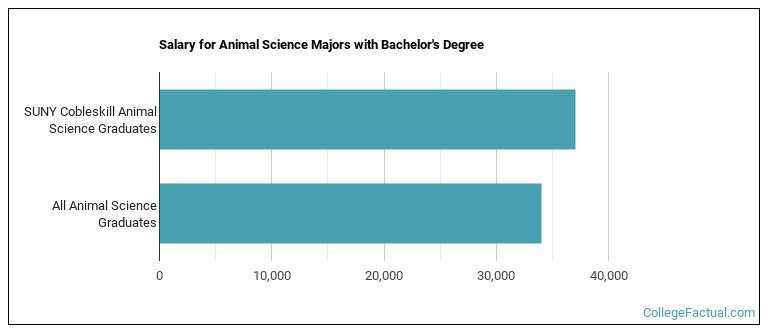
The median salary of animal science students who receive their bachelor's degree at SUNY Cobleskill is $37,068. This is higher than $34,062, which is the national median for all animal science bachelor's degree recipients.
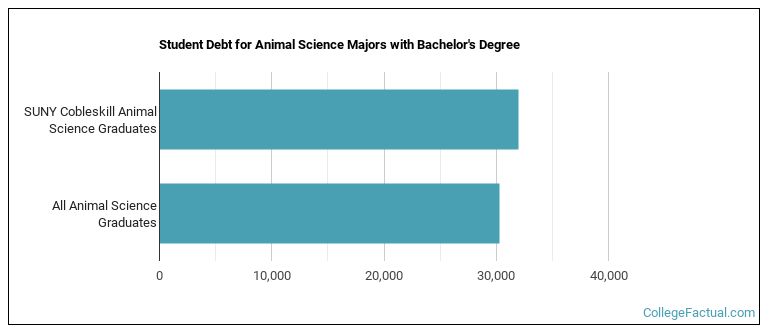
While getting their bachelor's degree at SUNY Cobleskill, animal science students borrow a median amount of $32,016 in student loans. This is higher than the the typical median of $30,313 for all animal science majors across the country.
The typical student loan payment of a bachelor's degree student from the animal science program at SUNY Cobleskill is $339 per month.
During the 2022-2023 academic year, part-time undergraduate students at SUNY Cobleskill paid an average of $708 per credit hour if they came to the school from out-of-state. In-state students paid a discounted rate of $295 per credit hour. The average full-time tuition and fees for undergraduates are shown in the table below.
| In State | Out of State | |
|---|---|---|
| Tuition | $7,070 | $16,980 |
| Fees | $1,606 | $1,606 |
| Books and Supplies | $1,200 | $1,200 |
| On Campus Room and Board | $16,250 | $16,250 |
| On Campus Other Expenses | $2,868 | $2,868 |
Learn more about SUNY Cobleskill tuition and fees.
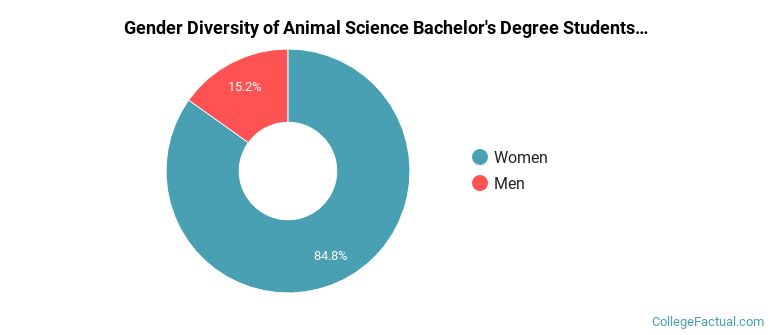
For the most recent academic year available, 15% of animal science bachelor's degrees went to men and 85% went to women.
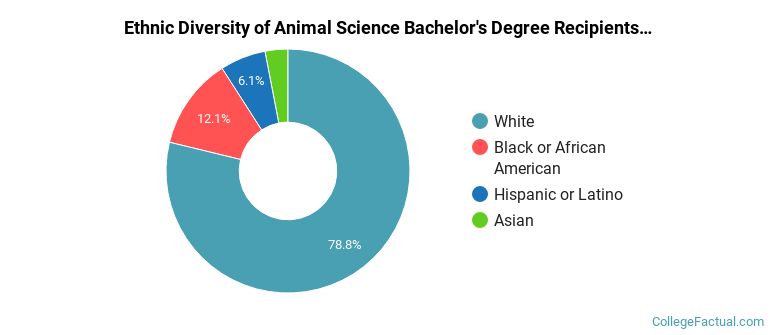
The majority of the students with this major are white. About 79% of 2022 graduates were in this category.
The following table and chart show the ethnic background for students who recently graduated from SUNY Cobleskill with a bachelor's in animal science.
| Ethnic Background | Number of Students |
|---|---|
| Asian | 2 |
| Black or African American | 8 |
| Hispanic or Latino | 4 |
| White | 52 |
| Non-Resident Aliens | 0 |
| Other Races | 0 |
Online degrees for the SUNY Cobleskill animal science bachelor’s degree program are not available at this time. To see if the school offers distance learning options in other areas, visit the SUNY Cobleskill Online Learning page.
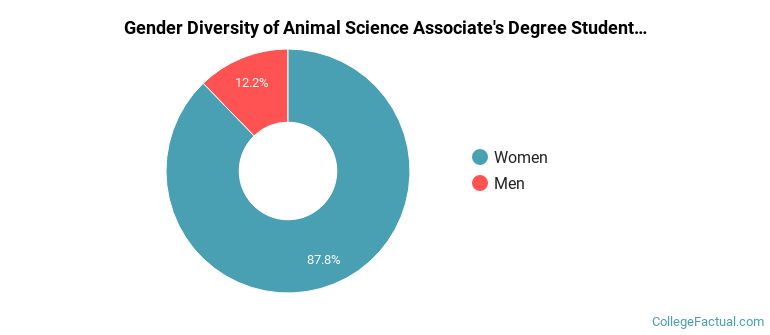
For the most recent academic year available, 12% of animal science associate's degrees went to men and 88% went to women.
The majority of the students with this major are white. About 82% of 2022 graduates were in this category.
The following table and chart show the ethnic background for students who recently graduated from SUNY Cobleskill with a associate's in animal science.
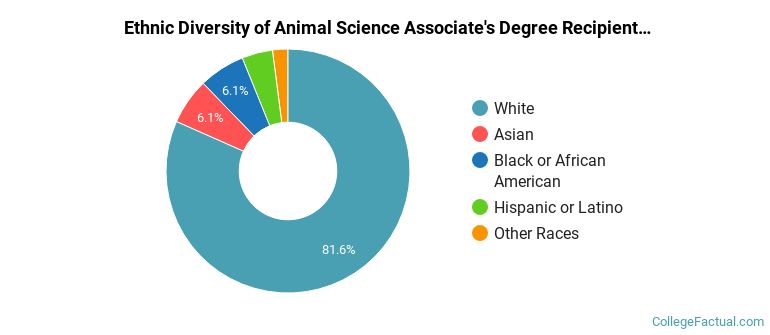
| Ethnic Background | Number of Students |
|---|---|
| Asian | 3 |
| Black or African American | 3 |
| Hispanic or Latino | 2 |
| White | 40 |
| Non-Resident Aliens | 0 |
| Other Races | 1 |
Take a look at the following statistics related to the make-up of the animal science majors at SUNY Cobleskill.
| Related Major | Annual Graduates |
|---|---|
| Agricultural Economics & Business | 37 |
| Animal Services | 23 |
| Agricultural Mechanization | 14 |
| Horticulture | 13 |
| Plant Sciences | 13 |