Here, you'll find out more about the major, including such details as the number of graduates, what degree levels are offered, ethnicity of students, and more. Also, learn how TCL ranks among other schools offering degrees in data processing.
Go directly to any of the following sections:
Learn about start dates, transferring credits, availability of financial aid, and more by contacting the universities below.
BS in Computer Science - Data Analysis
Build structured databases, explore big data and learn how to clean data in Southern New Hampshire University's online bachelor's in computer science with a concentration in data analysis.
BS in Information Technologies - Data Analytics
Learn to leverage data and develop innovative practices, products and processes with this specialized online bachelor's from Southern New Hampshire University.
The data processing major at TCL is not ranked on College Factual’s Best Colleges and Universities for Data Processing. This could be for a number of reasons, such as not having enough data on the major or school to make an accurate assessment of its quality.
In 2022-2023, the average part-time undergraduate tuition at TCL was $445 per credit hour for out-of-state students. The average for in-state students was $239 per credit hour. Information about average full-time undergraduate tuition and fees is shown in the table below.
| In State | Out of State | |
|---|---|---|
| Tuition | $5,736 | $10,680 |
| Fees | $364 | $364 |
| Books and Supplies | $1,300 | $1,300 |
Learn more about TCL tuition and fees.
Online degrees for the TCL data processing bachelor’s degree program are not available at this time. To see if the school offers distance learning options in other areas, visit the TCL Online Learning page.
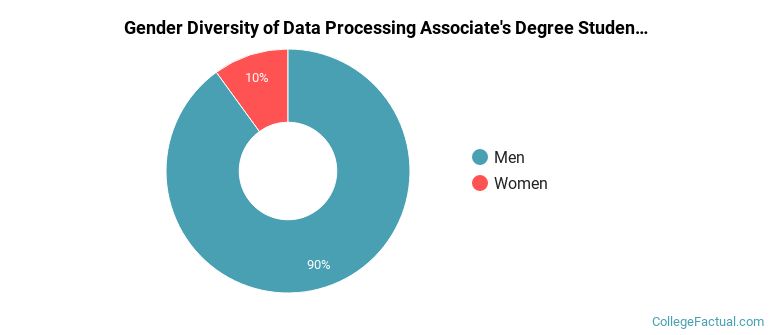
Of the 10 students who graduated with a Associate’s in data processing from TCL in 2022, 90% were men and 10% were women.
The following table and chart show the ethnic background for students who recently graduated from Technical College of the Lowcountry with a associate's in data processing.
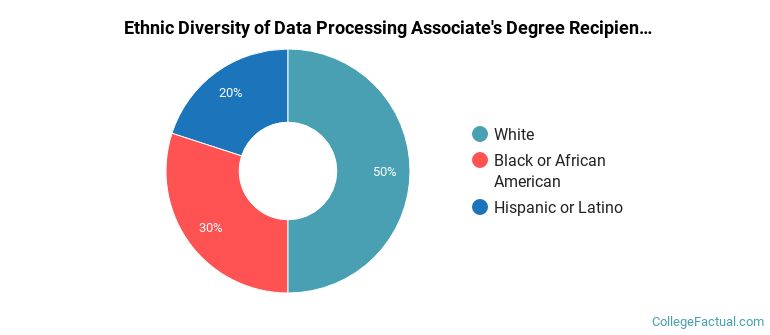
| Ethnic Background | Number of Students |
|---|---|
| Asian | 0 |
| Black or African American | 3 |
| Hispanic or Latino | 2 |
| White | 5 |
| Non-Resident Aliens | 0 |
| Other Races | 0 |
