Here, you'll find out more about the major, including such details as the number of graduates, what degree levels are offered, ethnicity of students, average salaries, and more. Also, learn how Temple ranks among other schools offering degrees in finance.
Go directly to any of the following sections:
Temple is in the top 10% of the country for finance. More specifically it was ranked #43 out of 531 schools by College Factual. It is also ranked #5 in Pennsylvania.
| Ranking Type | Rank |
|---|---|
| Best Finance & Financial Management Bachelor’s Degree Schools | 40 |
| Best Finance & Financial Management Schools | 43 |
During the 2021-2022 academic year, Temple University handed out 269 bachelor's degrees in finance & financial management. This is a decrease of 22% over the previous year when 346 degrees were handed out.
In 2022, 1 students received their master’s degree in finance from Temple. This makes it the #160 most popular school for finance master’s degree candidates in the country.
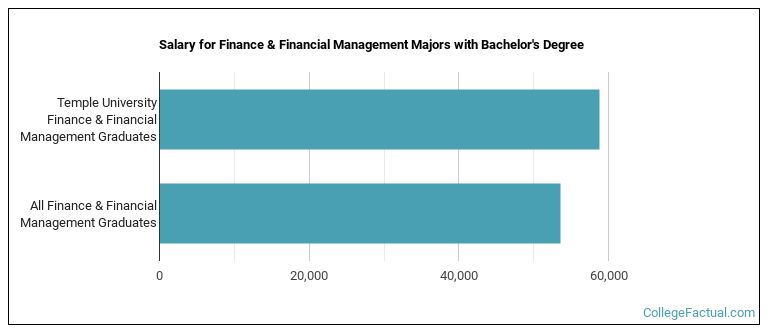
The median salary of finance students who receive their bachelor's degree at Temple is $58,807. This is higher than $53,649, which is the national median for all finance bachelor's degree recipients.
While getting their bachelor's degree at Temple, finance students borrow a median amount of $61,692 in student loans. This is higher than the the typical median of $34,962 for all finance majors across the country.
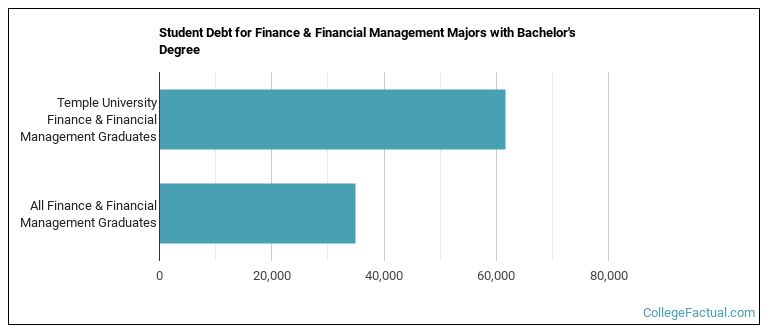
The typical student loan payment of a bachelor's degree student from the finance program at Temple is $666 per month.
Learn about other programs related to Finance & Financial Management that might interest you.
Managing and quantifying money is at the heart of the online bachelor's degree in finance at SNHU. You'll learn the fundamentals of investments, address key managerial issues, examine ethics from every angle and build the skillset to be a player in the multidimensional business marketplace.
Prepare to advance your current career in finance with Southern New Hampshire University's online Master's in Finance degree program.
During the 2022-2023 academic year, part-time undergraduate students at Temple paid an average of $1,388 per credit hour if they came to the school from out-of-state. In-state students paid a discounted rate of $833 per credit hour. The following table shows the average full-time tuition and fees for undergraduates.
| In State | Out of State | |
|---|---|---|
| Tuition | $21,023 | $36,280 |
| Fees | $968 | $968 |
| Books and Supplies | $1,240 | $1,240 |
| On Campus Room and Board | $16,968 | $16,968 |
| On Campus Other Expenses | $4,466 | $4,466 |
Learn more about Temple tuition and fees.
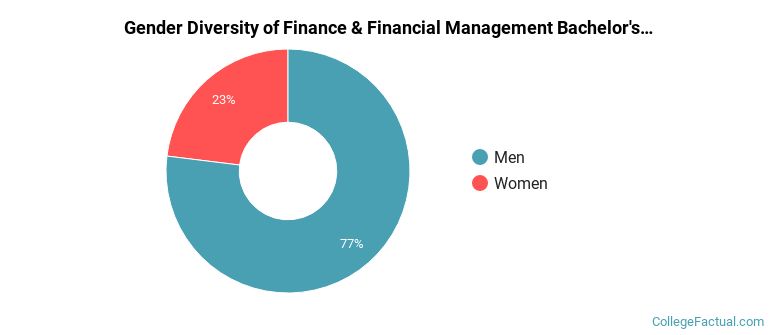
For the most recent academic year available, 77% of finance bachelor's degrees went to men and 23% went to women.
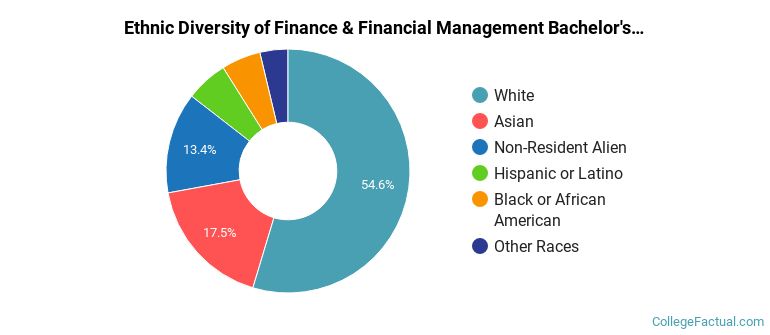
The majority of the students with this major are white. About 55% of 2022 graduates were in this category.
The following table and chart show the ethnic background for students who recently graduated from Temple University with a bachelor's in finance.
| Ethnic Background | Number of Students |
|---|---|
| Asian | 47 |
| Black or African American | 14 |
| Hispanic or Latino | 15 |
| White | 147 |
| Non-Resident Aliens | 36 |
| Other Races | 10 |
Online degrees for the Temple finance bachelor’s degree program are not available at this time. To see if the school offers distance learning options in other areas, visit the Temple Online Learning page.
Take a look at the following statistics related to the make-up of the finance majors at Temple University.
| Related Major | Annual Graduates |
|---|---|
| Business Administration & Management | 351 |
| Marketing | 228 |
| Accounting | 197 |
| Human Resource Management | 154 |
| Insurance | 150 |
More about our data sources and methodologies.
