Here, you'll find out more about the major, including such details as the number of graduates, what degree levels are offered, ethnicity of students, and more. We've also included details on how Temple ranks compared to other colleges offering a major in dance.
Jump to any of the following sections:
Temple is in the top 10% of the country for dance. More specifically it was ranked #7 out of 97 schools by College Factual. It is also ranked #1 in Pennsylvania.
| Ranking Type | Rank |
|---|---|
| Best Dance Schools | 7 |
| Best Dance Bachelor’s Degree Schools | 7 |
During the 2021-2022 academic year, Temple University handed out 13 bachelor's degrees in dance. This is an increase of 30% over the previous year when 10 degrees were handed out.
In 2022, 6 students received their master’s degree in dance from Temple. This makes it the #14 most popular school for dance master’s degree candidates in the country.
In addition, 1 students received their doctoral degrees in dance in 2022, making the school the #3 most popular school in the United States for this category of students.
Out-of-state part-time undergraduates at Temple paid an average of $1,388 per credit hour in 2022-2023. The average for in-state students was $833 per credit hour. The average full-time tuition and fees for undergraduates are shown in the table below.
| In State | Out of State | |
|---|---|---|
| Tuition | $21,023 | $36,280 |
| Fees | $968 | $968 |
| Books and Supplies | $1,240 | $1,240 |
| On Campus Room and Board | $16,968 | $16,968 |
| On Campus Other Expenses | $4,466 | $4,466 |
Learn more about Temple tuition and fees.
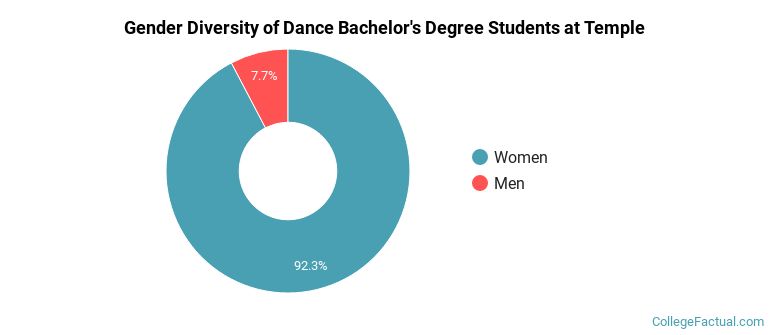
Of the 13 dance students who graduated with a bachelor's degree in 2021-2022 from Temple, about 8% were men and 92% were women.
The following table and chart show the ethnic background for students who recently graduated from Temple University with a bachelor's in dance.
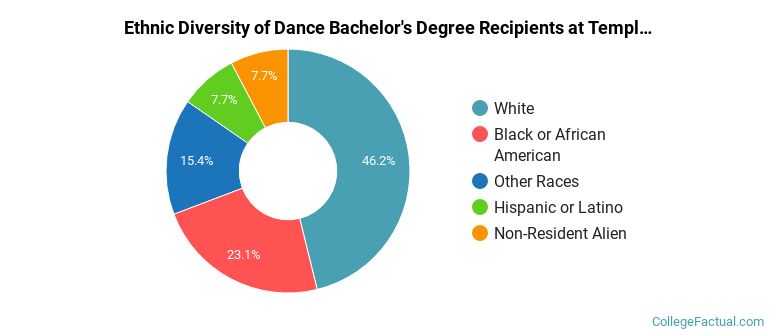
| Ethnic Background | Number of Students |
|---|---|
| Asian | 0 |
| Black or African American | 3 |
| Hispanic or Latino | 1 |
| White | 6 |
| Non-Resident Aliens | 1 |
| Other Races | 2 |
Online degrees for the Temple dance bachelor’s degree program are not available at this time. To see if the school offers distance learning options in other areas, visit the Temple Online Learning page.
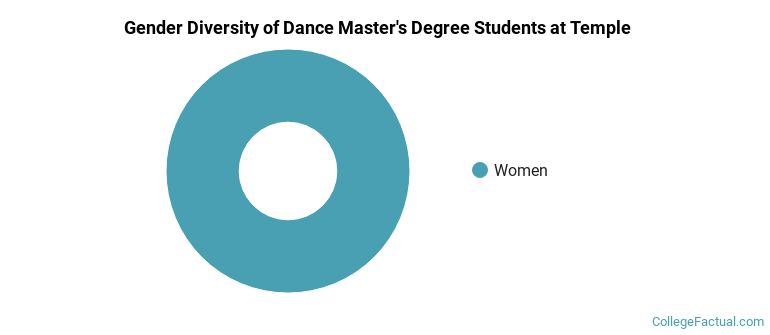
All of the 7 students who graduated with a Master’s in dance from Temple in 2022 were women.
The following table and chart show the ethnic background for students who recently graduated from Temple University with a master's in dance.
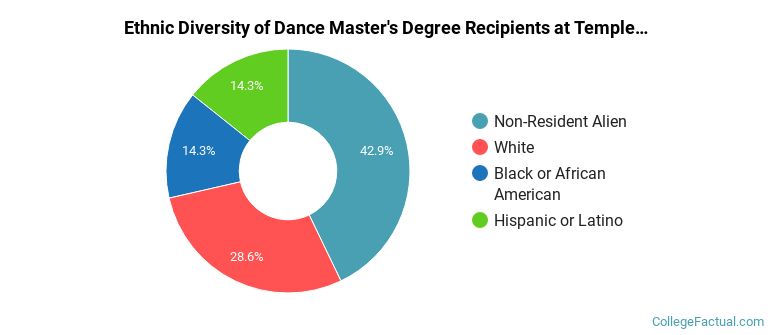
| Ethnic Background | Number of Students |
|---|---|
| Asian | 0 |
| Black or African American | 1 |
| Hispanic or Latino | 1 |
| White | 2 |
| Non-Resident Aliens | 3 |
| Other Races | 0 |
Take a look at the following statistics related to the make-up of the dance majors at Temple University.
| Related Major | Annual Graduates |
|---|---|
| Film, Video & Photographic Arts | 180 |
| Fine & Studio Arts | 117 |
| Music | 116 |
| Drama & Theater Arts | 81 |
| Design & Applied Arts | 60 |
More about our data sources and methodologies.