We've pulled together some essential information you should know about the program, including how many students graduate each year, the ethnic diversity of these students, average starting salaries, and more. Also, learn how Tennessee State University ranks among other schools offering degrees in phys ed.
Jump to any of the following sections:
The bachelor's program at Tennessee State University was ranked #480 on College Factual's Best Schools for phys ed list. It is also ranked #15 in Tennessee.
During the 2021-2022 academic year, Tennessee State University handed out 39 bachelor's degrees in health & physical education. This is a decrease of 17% over the previous year when 47 degrees were handed out.
In 2022, 7 students received their master’s degree in phys ed from Tennessee State University. This makes it the #281 most popular school for phys ed master’s degree candidates in the country.
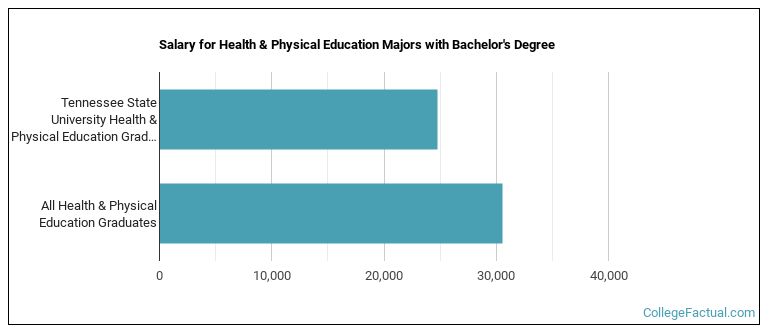
Phys Ed majors who earn their bachelor's degree from Tennessee State University go on to jobs where they make a median salary of $24,722 a year. This is less than $30,571, which is the national median of all phys ed majors in the nation who earn bachelor's degrees.
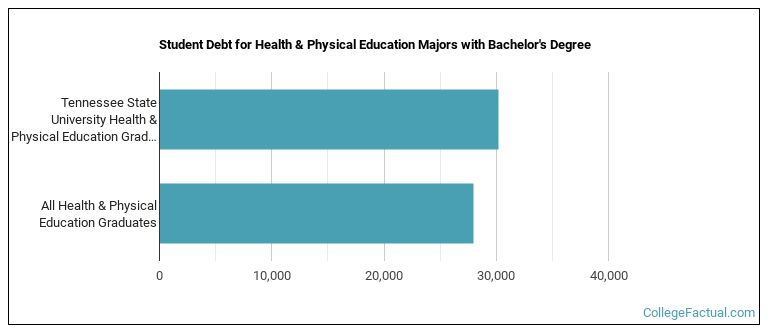
While getting their bachelor's degree at Tennessee State University, phys ed students borrow a median amount of $30,215 in student loans. This is higher than the the typical median of $28,017 for all phys ed majors across the country.
The typical student loan payment of a bachelor's degree student from the phys ed program at Tennessee State University is $250 per month.
During the 2022-2023 academic year, part-time undergraduate students at Tennessee State University paid an average of $836 per credit hour if they came to the school from out-of-state. In-state students paid a discounted rate of $291 per credit hour. The average full-time tuition and fees for undergraduates are shown in the table below.
| In State | Out of State | |
|---|---|---|
| Tuition | $7,320 | $21,036 |
| Fees | $1,248 | $1,248 |
| Books and Supplies | $1,600 | $1,600 |
| On Campus Room and Board | $10,120 | $10,120 |
| On Campus Other Expenses | $5,580 | $5,580 |
Learn more about Tennessee State University tuition and fees.
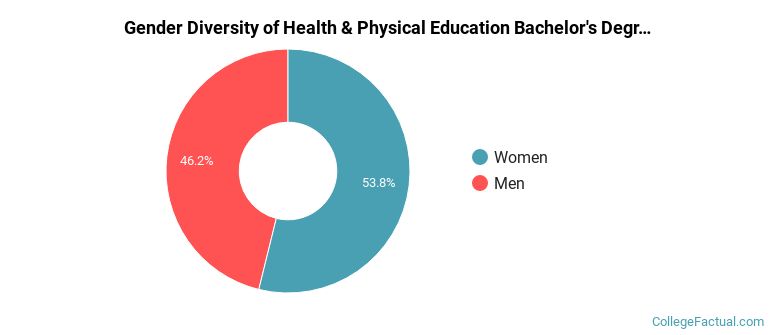
During the 2021-2022 academic year, 39 phys ed majors earned their bachelor's degree from Tennessee State University. Of these graduates, 46% were men and 54% were women.
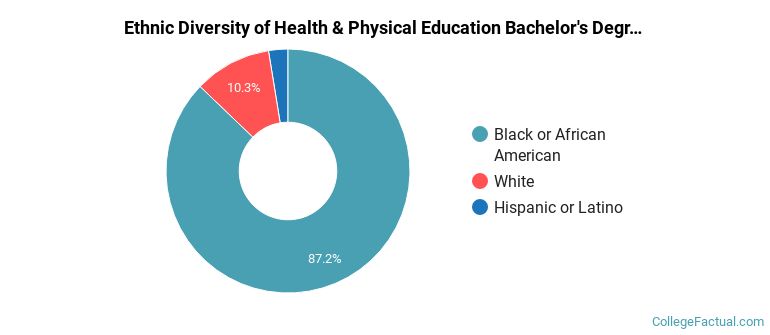
The majority of the bachelor's degree graduates for this major are black or African Americans. About 87% of grads fell into this category.
The following table and chart show the ethnic background for students who recently graduated from Tennessee State University with a bachelor's in phys ed.
| Ethnic Background | Number of Students |
|---|---|
| Asian | 0 |
| Black or African American | 34 |
| Hispanic or Latino | 1 |
| White | 4 |
| Non-Resident Aliens | 0 |
| Other Races | 0 |
Tennessee State University does not offer an online option for its phys ed bachelor’s degree program at this time. To see if the school offers distance learning options in other areas, visit the Tennessee State University Online Learning page.
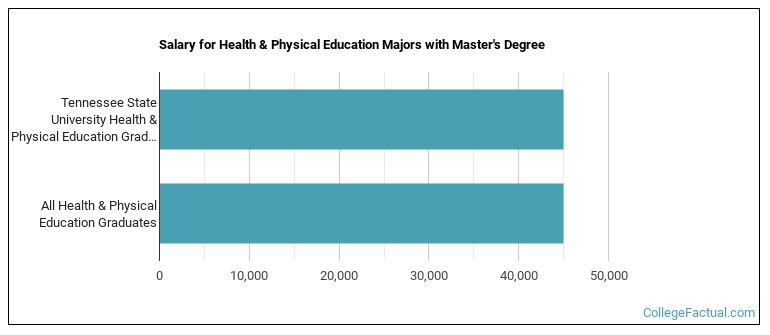
Graduates of the master's phys ed program at Tennessee State University make a median salary of $44,988. This is a better than average outcome since the median salary for all phys ed graduates with a master's is $44,941.
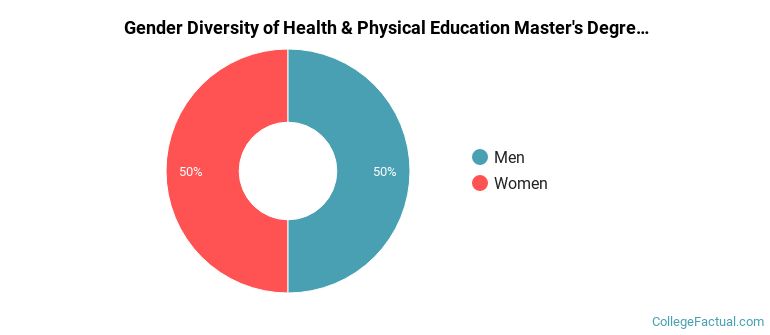
Of the 8 students who graduated with a Master’s in phys ed from Tennessee State University in 2022, 50% were men and 50% were women.
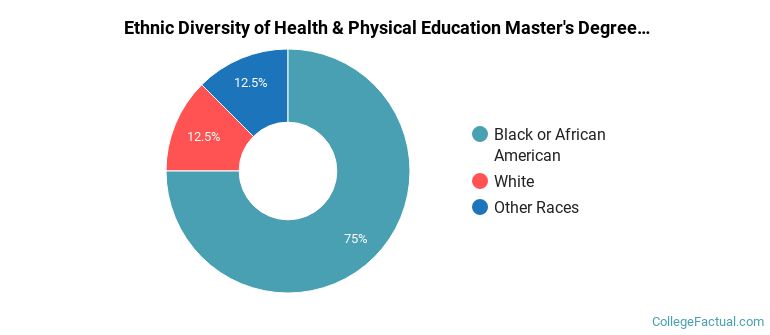
The majority of the master's degree graduates for this major are black or African Americans. About 75% of grads fell into this category.
The following table and chart show the ethnic background for students who recently graduated from Tennessee State University with a master's in phys ed.
| Ethnic Background | Number of Students |
|---|---|
| Asian | 0 |
| Black or African American | 6 |
| Hispanic or Latino | 0 |
| White | 1 |
| Non-Resident Aliens | 0 |
| Other Races | 1 |
Take a look at the following statistics related to the make-up of the phys ed majors at Tennessee State University.
More about our data sources and methodologies.