College Factual recognizes the best colleges and universities in its annual rankings. These rankings include categories for best overall colleges, best colleges for each major, best value schools, and much more.
The Juilliard School was awarded 11 badges in the 2025 rankings. The highest ranked major at the school is visual & performing arts.
Explore the best ranked schools for the programs you are most interested in.
Juilliard was not ranked in College Factual's Best Overall Colleges report this year. This may be because not enough data was available.
Even if you have the best grades and high test scores, that may not be enough to get into Juilliard since the school has one of the most selective in the country. Its acceptance rate is a mere 11%, so there's no shame if you don't get in. Be sure to apply to other schools just in case.
The student to faculty ratio is often used to measure the number of teaching resources that a college or university offers its students. The national average for this metric is 15 to 1, but at Juilliard it is much better at 4 to 1. That's good news for students who want to interact more on a personal level with their teachers.
In addition to the student to faculty ratio, some people look at what percentage of faculty members are full-time as a sign of how much time professors will be able to spend with their students. This is because part-time teachers may not be be on campus as much as their full-time counterparts.
The full-time faculty percentage at The Juilliard School is 27%. This is lower than the national average of 47%.
The freshmen retention rate of 99% tells us that most first-year, full-time students like The Juilliard School enough to come back for another year. This is a fair bit higher than the national average of 68%. That's certainly something to check off in the good column about the school.
The on-time graduation rate for someone pursuing a bachelor's degree is typically four years. This rate at Juilliard for first-time, full-time students is 84%, which is better than the national average of 33.3%.
Find out more about the retention and graduation rates at The Juilliard School.
During the 2017-2018 academic year, there were 589 undergraduates at Juilliard with 492 being full-time and 97 being part-time.
| $0-30 K | $30K-48K | $48-75 | $75-110K | $110K + |
|---|---|---|---|---|
| $23,313 | $26,991 | $38,332 | $50,541 | $50,708 |
The net price is calculated by adding tuition, room, board and other costs and subtracting financial aid.Note that the net price is typically less than the published for a school. For more information on the sticker price of Juilliard, see our tuition and fees and room and board pages.
Almost 66% of college students who graduated with the class of 2018 took out student loans, but that percentage varies from school to school. At Juilliard, approximately 32% of students took out student loans averaging $7,218 a year. That adds up to $28,872 over four years for those students.
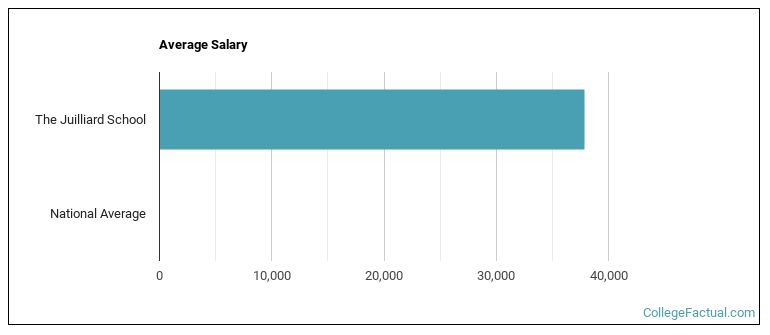
See which majors at The Juilliard School make the most money.
Get more details about the location of The Juilliard School.

Contact details for Juilliard are given below.
| Contact Details | |
|---|---|
| Address: | 60 Lincoln Center Plaza, New York, NY 10023-6588 |
| Phone: | 212-799-5000 |
| Website: | www.juilliard.edu/ |
| Most Popular Majors | Bachelor’s Degrees | Average Salary of Graduates |
|---|---|---|
| Music | 274 | NA |
| Dance | 21 | $14,220 |
| Drama & Theater Arts | 21 | NA |
Online learning options are becoming more and more popular at American colleges and universities. Online classes are great for students who have busy schedules or for those who just want to study on their own time.
In 2022-2023, 85 students took at least one online class at The Juilliard School. This is an increase from the 71 students who took online classes the previous year.
| Year | Took at Least One Online Class | Took All Classes Online |
|---|---|---|
| 2022-2023 | 85 | 74 |
| 2021-2022 | 71 | 61 |
| 2020-2021 | 961 | 272 |
| 2018-2019 | 0 | 0 |
Footnotes
*The racial-ethnic minorities count is calculated by taking the total number of students and subtracting white students, international students, and students whose race/ethnicity was unknown. This number is then divided by the total number of students at the school to obtain the racial-ethnic minorities percentage.
References
More about our data sources and methodologies.