
College Factual recognizes the best colleges and universities in its annual rankings. These rankings include categories for best overall colleges, best colleges for each major, best value schools, and much more.
The New School was awarded 24 badges in the 2025 rankings. The highest ranked major at the school is design & applied arts.
Explore the best ranked schools for the programs you are most interested in.
College Factual ranked New School University as #197 out of 2,152 colleges and universities in the country on its 2025 Best Colleges list. This puts it in the top 10% of all schools in the nation. This is an improvement over the previous year, when New School University held the #208 spot on the Best Overall Colleges list.
New School University is also ranked #22 out of 136 schools in New York.
The New School has an acceptance rate of 57%, which means the school is serious about who it admits. Take your time in putting together a strong application that highlights why you are a good fit for New School University.
At New School University, the student to faculty ratio is an excellent 10 to 1. That's much better than the national average of 15 to 1. This indicates that many classes will probably be small, and students will have ample opportunites to work closely with their professors and classmates.
In addition to the student to faculty ratio, some people look at what percentage of faculty members are full-time as a sign of how much time professors will be able to spend with their students. This is because part-time teachers may not be be on campus as much as their full-time counterparts.
The full-time faculty percentage at The New School is 19%. This is lower than the national average of 47%.
The freshmen retention rate of 83% tells us that most first-year, full-time students like The New School enough to come back for another year. This is a fair bit higher than the national average of 68%. That's certainly something to check off in the good column about the school.
The on-time graduation rate for someone pursuing a bachelor's degree is typically four years. This rate at New School University for first-time, full-time students is 56%, which is better than the national average of 33.3%.
Find out more about the retention and graduation rates at The New School.
During the 2017-2018 academic year, there were 6,399 undergraduates at New School University with 5,658 being full-time and 741 being part-time.
| $0-30 K | $30K-48K | $48-75 | $75-110K | $110K + |
|---|---|---|---|---|
| $42,659 | $43,329 | $46,039 | $50,804 | $55,183 |
The net price is calculated by adding tuition, room, board and other costs and subtracting financial aid.Note that the net price is typically less than the published for a school. For more information on the sticker price of New School University, see our tuition and fees and room and board pages.
Almost 66% of college students who graduated with the class of 2018 took out student loans, but that percentage varies from school to school. At New School University, approximately 32% of students took out student loans averaging $10,379 a year. That adds up to $41,516 over four years for those students.
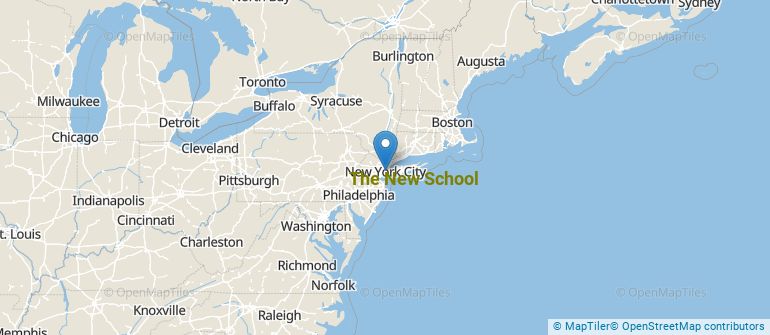
Get more details about the location of The New School.
Contact details for New School University are given below.
| Contact Details | |
|---|---|
| Phone: | 212-229-5600 |
| Website: | https://www.newschool.edu/ |
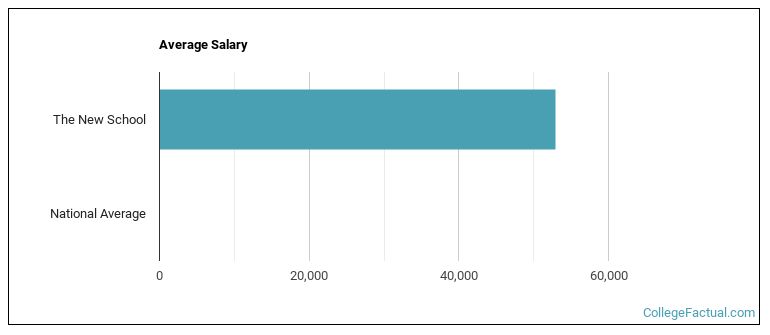
| Most Popular Majors | Bachelor’s Degrees | Average Salary of Graduates |
|---|---|---|
| Design & Applied Arts | 668 | $24,804 |
| Computer Software & Applications | 286 | $29,550 |
| Music | 211 | $12,109 |
| Radio, Television & Digital Communication | 175 | $32,169 |
| Arts & Media Management | 165 | $37,743 |
| Film, Video & Photographic Arts | 135 | $21,523 |
| Fine & Studio Arts | 123 | $20,967 |
| Systems Theory | 117 | NA |
| Liberal Arts General Studies | 105 | $27,701 |
| General Psychology | 101 | $34,033 |
Online learning options are becoming more and more popular at American colleges and universities. Online classes are great for students who have busy schedules or for those who just want to study on their own time.
In 2022-2023, 4,092 students took at least one online class at The New School. This is a decrease from the 5,821 students who took online classes the previous year.
| Year | Took at Least One Online Class | Took All Classes Online |
|---|---|---|
| 2022-2023 | 4,092 | 304 |
| 2021-2022 | 5,821 | 528 |
| 2020-2021 | 8,921 | 8,570 |
| 2018-2019 | 1,147 | 248 |
If you’re considering The New School, here are some more schools you may be interested in knowing more about.
Curious on how these schools stack up against New School University? Pit them head to head with College Combat, our free interactive tool that lets you compare college on the features that matter most to you!
Footnotes
*The racial-ethnic minorities count is calculated by taking the total number of students and subtracting white students, international students, and students whose race/ethnicity was unknown. This number is then divided by the total number of students at the school to obtain the racial-ethnic minorities percentage.
References
More about our data sources and methodologies.