Here, you'll find out more about the major, including such details as the number of graduates, what degree levels are offered, ethnicity of students, average salaries, and more. We've also included details on how UM ranks compared to other colleges offering a major in biological science.
Go directly to any of the following sections:
The biological science major at UM is not ranked on College Factual’s Best Colleges and Universities for Biological & Physical Science. This could be for a number of reasons, such as not having enough data on the major or school to make an accurate assessment of its quality.
During the 2021-2022 academic year, The University of Montana handed out 0 bachelor's degrees in biological & physical science.
In 2022, 1 students received their master’s degree in biological science from UM. This makes it the #24 most popular school for biological science master’s degree candidates in the country.
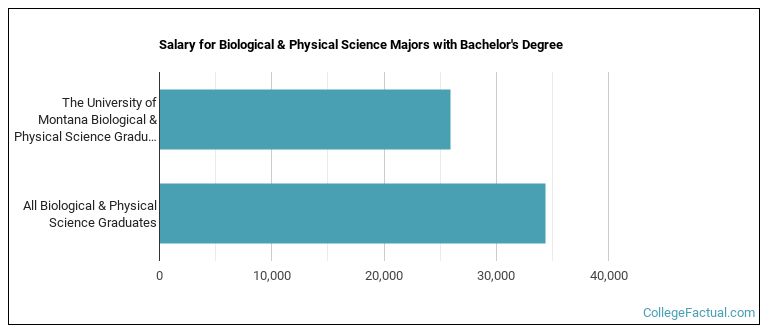
The median salary of biological science students who receive their bachelor's degree at UM is $25,950. This is less than $34,380, which is the national median of all biological science majors in the nation who earn bachelor's degrees.
During the 2022-2023 academic year, part-time undergraduate students at UM paid an average of $1,200 per credit hour if they came to the school from out-of-state. In-state students paid a discounted rate of $239 per credit hour. The average full-time tuition and fees for undergraduates are shown in the table below.
| In State | Out of State | |
|---|---|---|
| Tuition | $5,736 | $28,800 |
| Fees | $2,416 | $2,822 |
| Books and Supplies | $1,100 | $1,100 |
| On Campus Room and Board | $12,192 | $12,192 |
| On Campus Other Expenses | $3,784 | $3,784 |
Learn more about UM tuition and fees.
Online degrees for the UM biological science bachelor’s degree program are not available at this time. To see if the school offers distance learning options in other areas, visit the UM Online Learning page.
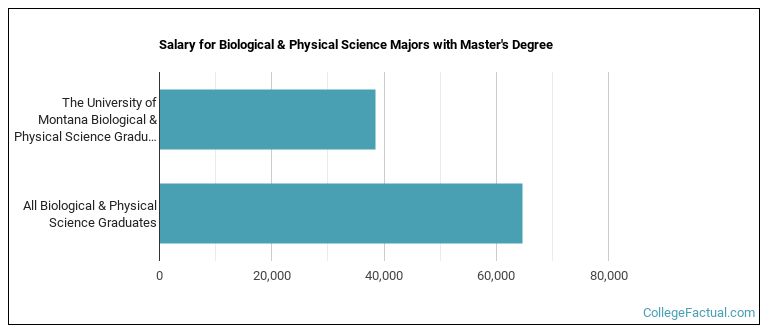
Graduates of the master's biological science program at UM make a median salary of $38,426. This is less than what their typical peers from other schools make. Their median salary is $64,726.
| Related Major | Annual Graduates |
|---|---|
| Other Multi/Interdisciplinary Studies | 13 |
| Sustainability Science | 4 |
| International Studies | 2 |
| Mathematics & Computer Science | 1 |
More about our data sources and methodologies.