Here, you'll find out more about the major, including such details as the number of graduates, what degree levels are offered, ethnicity of students, average salaries, and more. We've also included details on how UT Austin ranks compared to other colleges offering a major in me.
Jump to any of the following sections:
Ranked at #4 in College Factual's most recent rankings, UT Austin is in the top 1% of the country for me students pursuing a bachelor's degree. It is also ranked #1 in Texas.
During the 2021-2022 academic year, The University of Texas at Austin handed out 266 bachelor's degrees in mechanical engineering. This is a decrease of 3% over the previous year when 274 degrees were handed out.
In 2022, 51 students received their master’s degree in me from UT Austin. This makes it the #48 most popular school for me master’s degree candidates in the country.
In addition, 34 students received their doctoral degrees in me in 2022, making the school the #6 most popular school in the United States for this category of students.
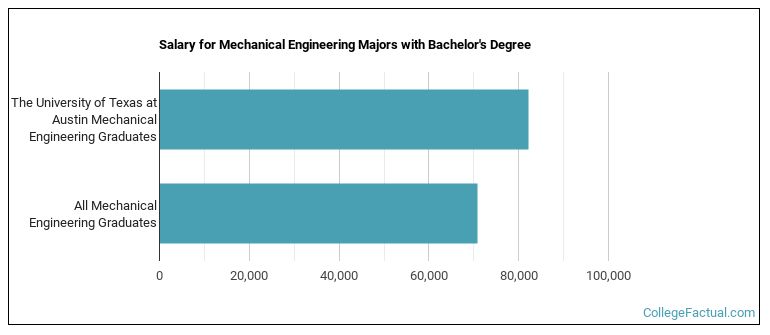
ME majors who earn their bachelor's degree from UT Austin go on to jobs where they make a median salary of $82,227 a year. This is higher than $70,726, which is the national median for all me bachelor's degree recipients.
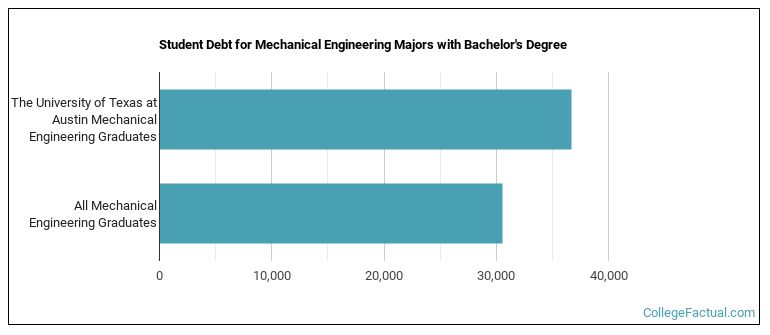
While getting their bachelor's degree at UT Austin, me students borrow a median amount of $36,679 in student loans. This is higher than the the typical median of $30,590 for all me majors across the country.
The typical student loan payment of a bachelor's degree student from the me program at UT Austin is $320 per month.
Out-of-state part-time undergraduates at UT Austin paid an average of $1,930 per credit hour in 2022-2023. The average for in-state students was $546 per credit hour. The average full-time tuition and fees for undergraduates are shown in the table below.
| In State | Out of State | |
|---|---|---|
| Tuition | $11,678 | $42,778 |
| Books and Supplies | $724 | $724 |
| On Campus Room and Board | $14,136 | $14,136 |
| On Campus Other Expenses | $5,034 | $5,034 |
Learn more about UT Austin tuition and fees.
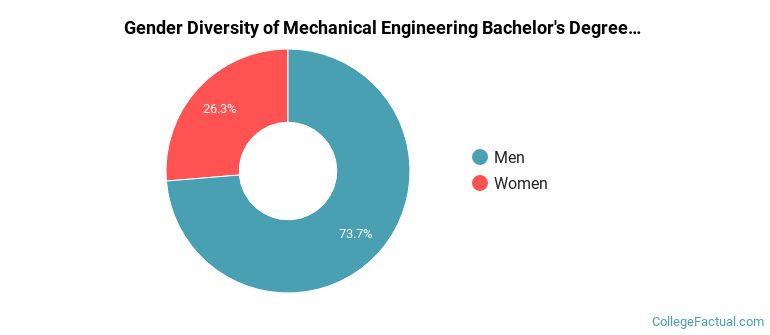
In the 2021-2022 academic year, 266 students earned a bachelor's degree in me from UT Austin. About 26% of these graduates were women and the other 74% were men.
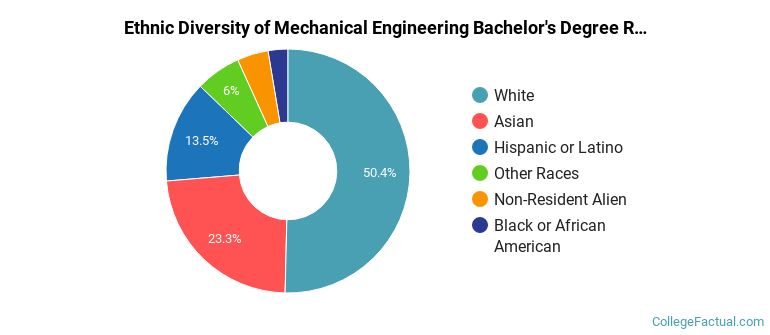
The majority of the students with this major are white. About 50% of 2022 graduates were in this category.
The following table and chart show the ethnic background for students who recently graduated from The University of Texas at Austin with a bachelor's in me.
| Ethnic Background | Number of Students |
|---|---|
| Asian | 62 |
| Black or African American | 7 |
| Hispanic or Latino | 36 |
| White | 134 |
| Non-Resident Aliens | 11 |
| Other Races | 16 |
UT Austin does not offer an online option for its me bachelor’s degree program at this time. To see if the school offers distance learning options in other areas, visit the UT Austin Online Learning page.
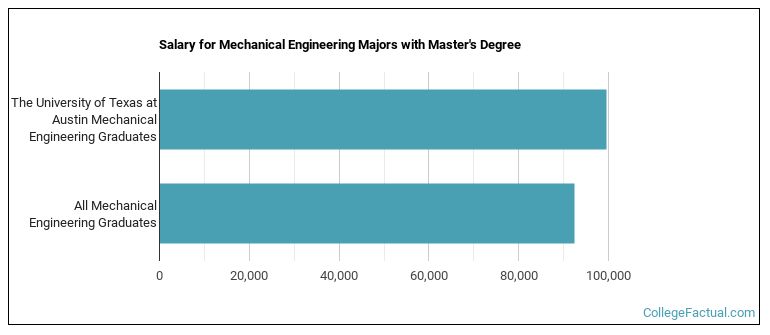
ME majors graduating with a master's degree from UT Austin make a median salary of $99,576 a year. This is a better than average outcome since the median salary for all me graduates with a master's is $92,526.
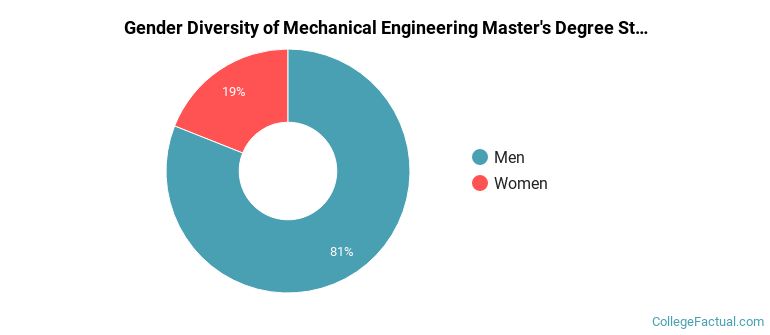
For the most recent academic year available, 81% of me master's degrees went to men and 19% went to women.
The majority of the students with this major are white. About 56% of 2022 graduates were in this category.
The following table and chart show the ethnic background for students who recently graduated from The University of Texas at Austin with a master's in me.
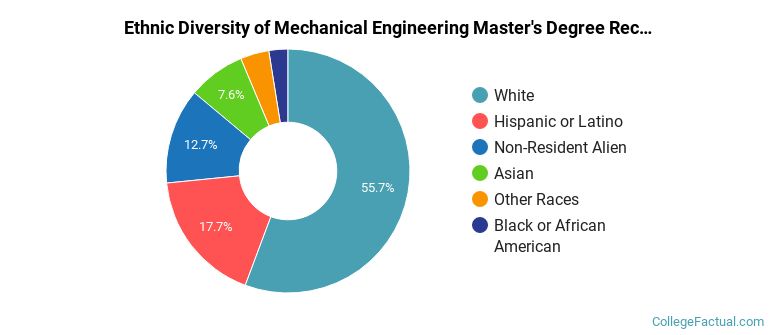
| Ethnic Background | Number of Students |
|---|---|
| Asian | 6 |
| Black or African American | 2 |
| Hispanic or Latino | 14 |
| White | 44 |
| Non-Resident Aliens | 10 |
| Other Races | 3 |
Take a look at the following statistics related to the make-up of the me majors at The University of Texas at Austin.
| Related Major | Annual Graduates |
|---|---|
| Electrical Engineering | 320 |
| Civil Engineering | 225 |
| Chemical Engineering | 165 |
| Biomedical Engineering | 154 |
| Electrical and Computer Engineering. | 140 |
More about our data sources and methodologies.