Here, you'll find out more about the major, including such details as the number of graduates, what degree levels are offered, ethnicity of students, average salaries, and more. We've also included details on how UT Rio Grande Valley ranks compared to other colleges offering a major in ce.
Go directly to any of the following sections:
The bachelor's program at UT Rio Grande Valley was ranked #195 on College Factual's Best Schools for ce list. It is also ranked #11 in Texas.
| Ranking Type | Rank |
|---|---|
| Best Computer Engineering Bachelor’s Degree Schools | 184 |
| Best Computer Engineering Schools | 195 |
During the 2021-2022 academic year, The University of Texas Rio Grande Valley handed out 47 bachelor's degrees in computer engineering. This is an increase of 27% over the previous year when 37 degrees were handed out.
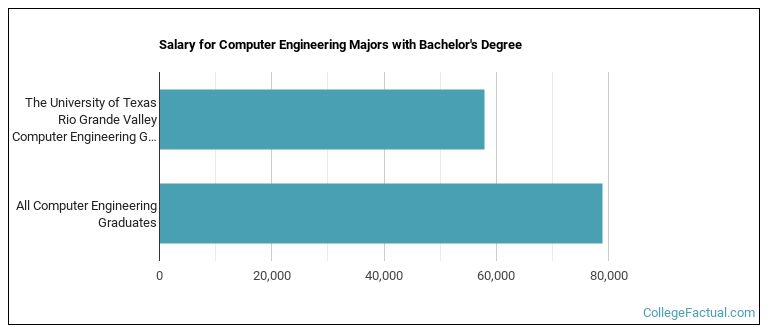
The median salary of ce students who receive their bachelor's degree at UT Rio Grande Valley is $57,841. This is less than $78,964, which is the national median of all ce majors in the nation who earn bachelor's degrees.
In 2022-2023, the average part-time undergraduate tuition at UT Rio Grande Valley was $742 per credit hour for out-of-state students. The average for in-state students was $332 per credit hour. The following table shows the average full-time tuition and fees for undergraduates.
| In State | Out of State | |
|---|---|---|
| Tuition | $7,637 | $17,707 |
| Fees | $1,830 | $1,835 |
| Books and Supplies | $1,190 | $1,190 |
| On Campus Room and Board | $9,662 | $9,662 |
| On Campus Other Expenses | $3,766 | $3,766 |
Learn more about UT Rio Grande Valley tuition and fees.
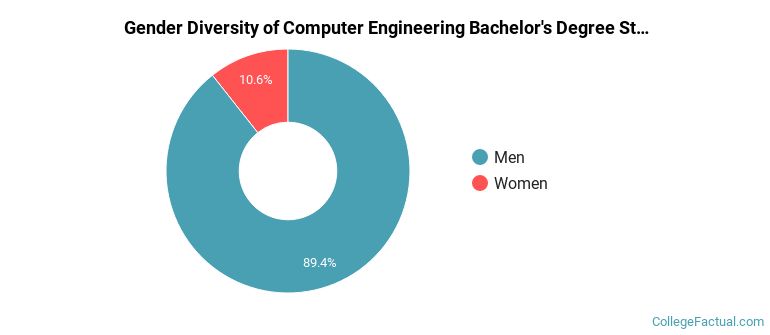
For the most recent academic year available, 89% of ce bachelor's degrees went to men and 11% went to women.
The majority of the bachelor's degree graduates for this major are Hispanic or Latino. In the most recent graduating class for which data is available, 94% of grads fell into this category.
The following table and chart show the ethnic background for students who recently graduated from The University of Texas Rio Grande Valley with a bachelor's in ce.
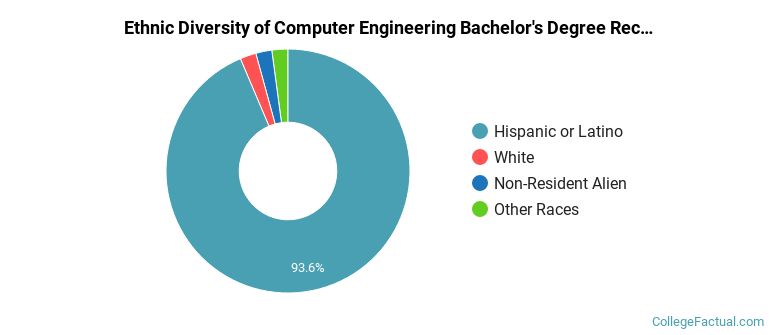
| Ethnic Background | Number of Students |
|---|---|
| Asian | 0 |
| Black or African American | 0 |
| Hispanic or Latino | 44 |
| White | 1 |
| Non-Resident Aliens | 1 |
| Other Races | 1 |
Online degrees for the UT Rio Grande Valley ce bachelor’s degree program are not available at this time. To see if the school offers distance learning options in other areas, visit the UT Rio Grande Valley Online Learning page.
Take a look at the following statistics related to the make-up of the ce majors at The University of Texas Rio Grande Valley.
| Related Major | Annual Graduates |
|---|---|
| Mechanical Engineering | 156 |
| Civil Engineering | 117 |
| Electrical Engineering | 65 |
| Manufacturing Engineering | 23 |