
College Factual analyzes over 2,000 colleges and universities in its annual rankings and ranks them in a variety of ways, including most diverse, best overall quality, best for non-traditional students, and much more.
Union Institute & University was awarded 19 badges in the 2025 rankings. The highest ranked major at the school is criminal justice & corrections.
Explore the best ranked schools for the programs you are most interested in.
Union is ranked #124 out of 2,152 schools in the nation for overall quality on College Factual's 2025 Best Colleges list. This puts it in the top 10% of all schools in the nation. This is an improvement over the previous year, when Union held the #306 spot on the Best Overall Colleges list.
Union is also ranked #4 out of 91 schools in Ohio.
Union Institute & University has an open admissions policy, so you should not have much trouble being accepted by the school. Still, it is important to fill out the application completely and submit any requested materials, which may include proof that you have a high school diploma or the equivalent.
The student to faculty ratio at Union is an impressive 6 to 1. That's quite good when you compare it to the national average of 15 to 1. This is a good sign that students at the school will have more opportunities for one-on-one interactions with their professors.
Another measure that is often used to estimate how much access students will have to their professors is how many faculty members are full-time. The idea here is that part-time faculty tend to spend less time on campus, so they may not be as available to students as full-timers.
The full-time faculty percentage at Union Institute & University is 16%. This is lower than the national average of 47%.
Union Institute & University has a freshmen retention rate of 100%. That's a good sign that full-time students like the school and their professors enough to want to stick around for another year. It's also a sign that the admissions team did a good job in choosing applicants who were a good fit for the school.
When we say that a student has graduated on time, we mean that they have finished their bachelor's degree within four years. The on-time graduation rate at Union is 25%. That's lower than the national rate of 33.3%
Find out more about the retention and graduation rates at Union Institute & University.
During the 2017-2018 academic year, there were 575 undergraduates at Union with 227 being full-time and 348 being part-time.
The net price is calculated by adding tuition, room, board and other costs and subtracting financial aid.Note that the net price is typically less than the published for a school. For more information on the sticker price of Union, see our tuition and fees and room and board pages.
It's not uncommon for college students to take out loans to pay for school. In fact, almost 66% of students nationwide depend at least partially on loans. At Union, approximately 100% of students took out student loans averaging $9,500 a year. That adds up to $38,000 over four years for those students.
Get more details about paying for Union Institute & University.
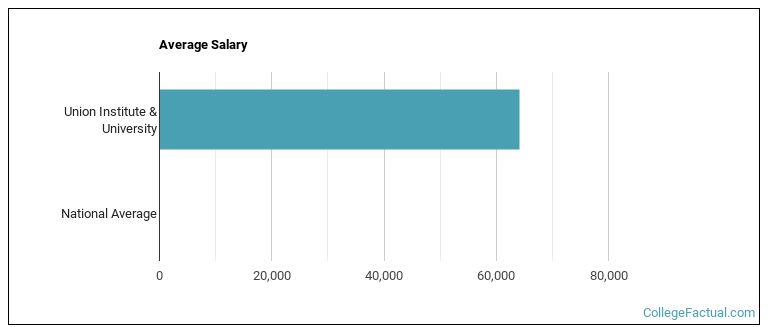
See which majors at Union Institute & University make the most money.
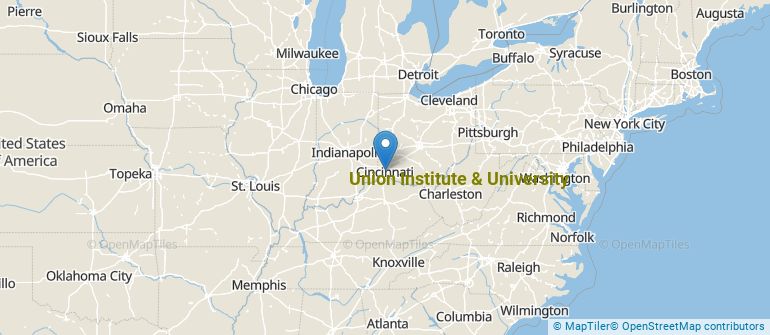
Get more details about the location of Union Institute & University.
Contact details for Union are given below.
| Contact Details | |
|---|---|
| Address: | 2090 Florence Avenue, Cincinnati, OH 45206 |
| Phone: | 800-861-6400 |
| Website: | https://www.myunion.edu/ |
| Most Popular Majors | Bachelor’s Degrees | Average Salary of Graduates |
|---|---|---|
| Criminal Justice & Corrections | 159 | $124,236 |
| Homeland Security | 62 | $165,273 |
| Business Administration & Management | 34 | NA |
| Human Development & Family Studies | 27 | $39,397 |
| Public Health | 19 | $47,812 |
| Mental & Social Health Services | 11 | NA |
| Other Multi/Interdisciplinary Studies | 7 | NA |
| General Psychology | 7 | NA |
| Social Work | 7 | $43,240 |
| Allied Health & Medical Assisting Services | 6 | NA |
Online learning is becoming popular at even the oldest colleges and universities in the United States. Not only are online classes great for returning adults with busy schedules, they are also frequented by a growing number of traditional students.
In 2022-2023, 787 students took at least one online class at Union Institute & University. This is an increase from the 776 students who took online classes the previous year.
| Year | Took at Least One Online Class | Took All Classes Online |
|---|---|---|
| 2022-2023 | 787 | 659 |
| 2021-2022 | 776 | 624 |
| 2020-2021 | 668 | 647 |
| 2018-2019 | 918 | 638 |
Learn more about online learning at Union Institute & University.
If you’re considering Union Institute & University, here are some more schools you may be interested in knowing more about.
Curious on how these schools stack up against Union? Pit them head to head with College Combat, our free interactive tool that lets you compare college on the features that matter most to you!
Footnotes
*The racial-ethnic minorities count is calculated by taking the total number of students and subtracting white students, international students, and students whose race/ethnicity was unknown. This number is then divided by the total number of students at the school to obtain the racial-ethnic minorities percentage.
References
More about our data sources and methodologies.