We've gathered data and other essential information about the program, such as the average salary of graduates, ethnicity of students, how many students graduated in recent times, and more. Also, learn how University at Buffalo ranks among other schools offering degrees in ce.
Jump to any of the following sections:
The bachelor's program at University at Buffalo was ranked #110 on College Factual's Best Schools for ce list. It is also ranked #8 in New York.
| Ranking Type | Rank |
|---|---|
| Best Computer Engineering Bachelor’s Degree Schools | 107 |
| Best Computer Engineering Schools | 110 |
During the 2021-2022 academic year, University at Buffalo handed out 33 bachelor's degrees in computer engineering. This is an increase of 6% over the previous year when 31 degrees were handed out.
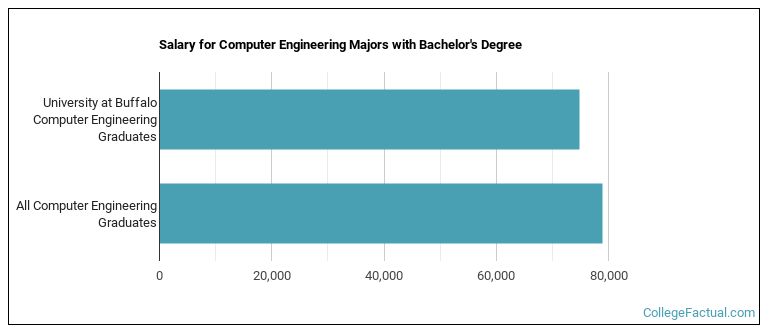
CE majors who earn their bachelor's degree from University at Buffalo go on to jobs where they make a median salary of $74,753 a year. Unfortunately, this is lower than the national average of $78,964 for all ce students.
Out-of-state part-time undergraduates at University at Buffalo paid an average of $1,119 per credit hour in 2022-2023. The average for in-state students was $295 per credit hour. The following table shows the average full-time tuition and fees for undergraduates.
| In State | Out of State | |
|---|---|---|
| Tuition | $7,070 | $26,860 |
| Fees | $3,712 | $3,712 |
| Books and Supplies | $1,500 | $1,500 |
| On Campus Room and Board | $16,754 | $16,754 |
| On Campus Other Expenses | $4,752 | $4,752 |
Learn more about University at Buffalo tuition and fees.
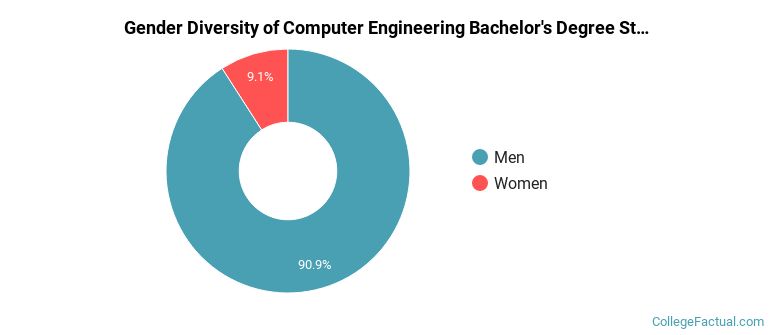
Of the 33 students who graduated with a Bachelor’s in ce from University at Buffalo in 2022, 91% were men and 9% were women.
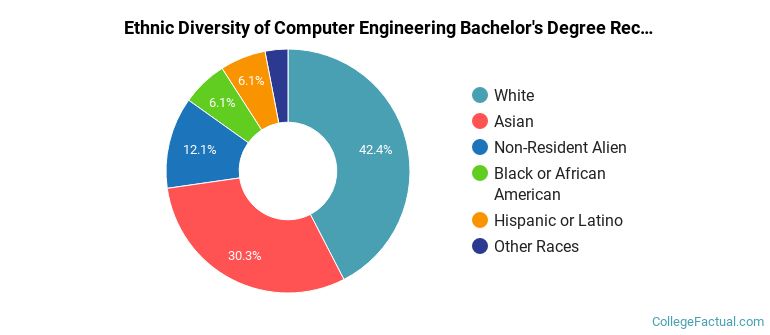
The following table and chart show the ethnic background for students who recently graduated from University at Buffalo with a bachelor's in ce.
| Ethnic Background | Number of Students |
|---|---|
| Asian | 10 |
| Black or African American | 2 |
| Hispanic or Latino | 2 |
| White | 14 |
| Non-Resident Aliens | 4 |
| Other Races | 1 |
University at Buffalo does not offer an online option for its ce bachelor’s degree program at this time. To see if the school offers distance learning options in other areas, visit the University at Buffalo Online Learning page.
Take a look at the following statistics related to the make-up of the ce majors at University at Buffalo.
| Related Major | Annual Graduates |
|---|---|
| Mechanical Engineering | 281 |
| Civil Engineering | 218 |
| General Engineering | 176 |
| Electrical Engineering | 157 |
| Biomedical Engineering | 136 |
More about our data sources and methodologies.