We've pulled together some essential information you should know about the program, including how many students graduate each year, the ethnic diversity of these students, average starting salaries, and more. In addition, we cover how UAB ranks in comparison to other schools with liberal arts programs.
Jump to any of the following sections:
The bachelor's program at UAB was ranked #476 on College Factual's Best Schools for liberal arts list. It is also ranked #14 in Alabama.
| Ranking Type | Rank |
|---|---|
| Best Liberal Arts General Studies Bachelor’s Degree Schools | 208 |
| Best Liberal Arts General Studies Schools | 476 |
During the 2021-2022 academic year, University of Alabama at Birmingham handed out 95 bachelor's degrees in liberal arts general studies. This is a decrease of 3% over the previous year when 98 degrees were handed out.
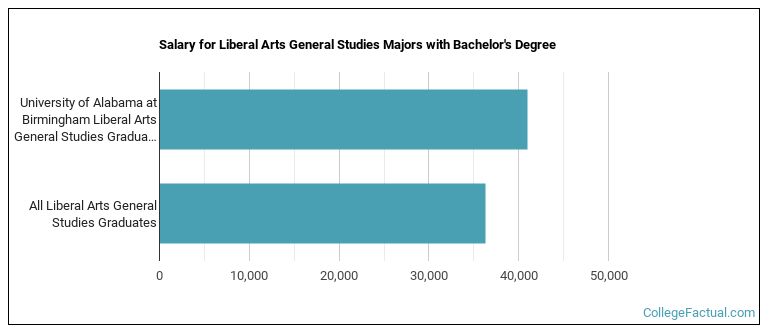
The median salary of liberal arts students who receive their bachelor's degree at UAB is $40,968. This is higher than $36,340, which is the national median for all liberal arts bachelor's degree recipients.
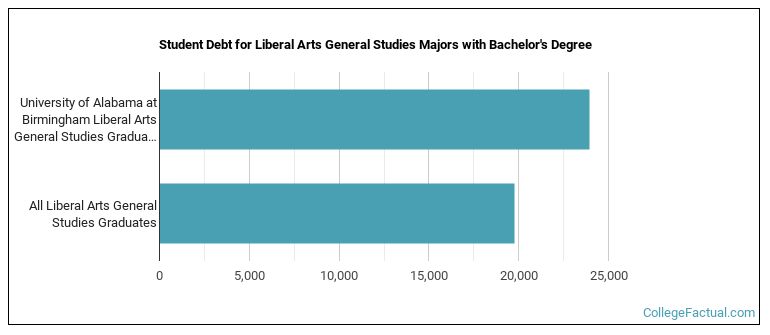
While getting their bachelor's degree at UAB, liberal arts students borrow a median amount of $23,949 in student loans. This is higher than the the typical median of $19,782 for all liberal arts majors across the country.
Learn about other programs related to Liberal Arts General Studies that might interest you.
Maximize your transfer credits and complete your bachelor's degree faster with this flexible online bachelor's from Southern New Hampshire University.
During the 2022-2023 academic year, part-time undergraduate students at UAB paid an average of $911 per credit hour if they came to the school from out-of-state. In-state students paid a discounted rate of $368 per credit hour. Information about average full-time undergraduate tuition and fees is shown in the table below.
| In State | Out of State | |
|---|---|---|
| Tuition | $8,832 | $21,864 |
| Books and Supplies | $1,200 | $1,200 |
| On Campus Room and Board | $13,590 | $13,590 |
| On Campus Other Expenses | $5,757 | $5,757 |
Learn more about UAB tuition and fees.
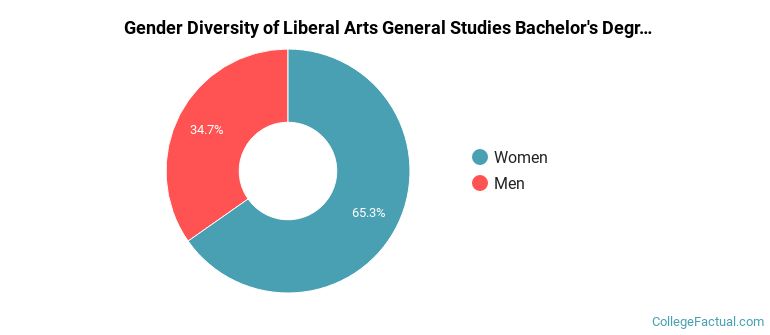
Of the 95 students who earned a bachelor's degree in Liberal Arts General Studies from UAB in 2021-2022, 35% were men and 65% were women.
The following table and chart show the ethnic background for students who recently graduated from University of Alabama at Birmingham with a bachelor's in liberal arts.
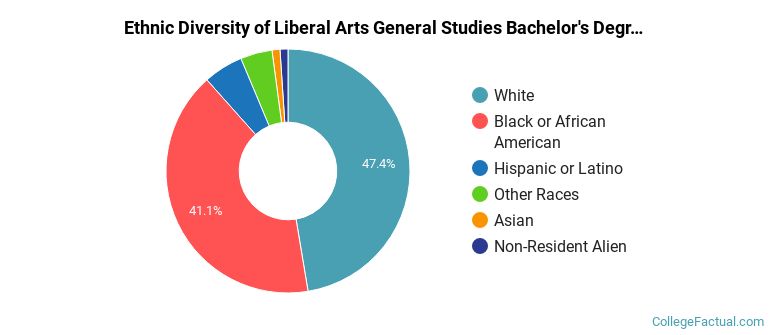
| Ethnic Background | Number of Students |
|---|---|
| Asian | 1 |
| Black or African American | 39 |
| Hispanic or Latino | 5 |
| White | 45 |
| Non-Resident Aliens | 1 |
| Other Races | 4 |
UAB does not offer an online option for its liberal arts bachelor’s degree program at this time. To see if the school offers distance learning options in other areas, visit the UAB Online Learning page.
Take a look at the following statistics related to the make-up of the liberal arts majors at University of Alabama at Birmingham.
More about our data sources and methodologies.
