Here, you'll find out more about the major, including such details as the number of graduates, what degree levels are offered, ethnicity of students, average salaries, and more. In addition, we cover how UAPB ranks in comparison to other schools with criminal justice programs.
Jump to any of the following sections:
The bachelor's program at UAPB was ranked #598 on College Factual's Best Schools for criminal justice list. It is also ranked #7 in Arkansas.
| Ranking Type | Rank |
|---|---|
| Best Criminal Justice & Corrections Bachelor’s Degree Schools | 381 |
| Best Criminal Justice & Corrections Schools | 598 |
During the 2021-2022 academic year, University of Arkansas at Pine Bluff handed out 22 bachelor's degrees in criminal justice & corrections. This is a decrease of 12% over the previous year when 25 degrees were handed out.
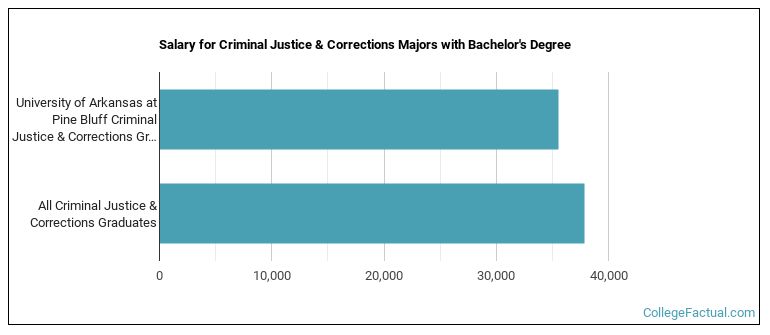
Criminal Justice majors who earn their bachelor's degree from UAPB go on to jobs where they make a median salary of $35,532 a year. This is less than $37,901, which is the national median of all criminal justice majors in the nation who earn bachelor's degrees.
During the 2022-2023 academic year, part-time undergraduate students at UAPB paid an average of $469 per credit hour if they came to the school from out-of-state. In-state students paid a discounted rate of $202 per credit hour. The following table shows the average full-time tuition and fees for undergraduates.
| In State | Out of State | |
|---|---|---|
| Tuition | $6,060 | $14,070 |
| Fees | $2,959 | $2,959 |
| Books and Supplies | $1,120 | $1,120 |
| On Campus Room and Board | $9,122 | $9,122 |
| On Campus Other Expenses | $4,070 | $4,070 |
Learn more about UAPB tuition and fees.
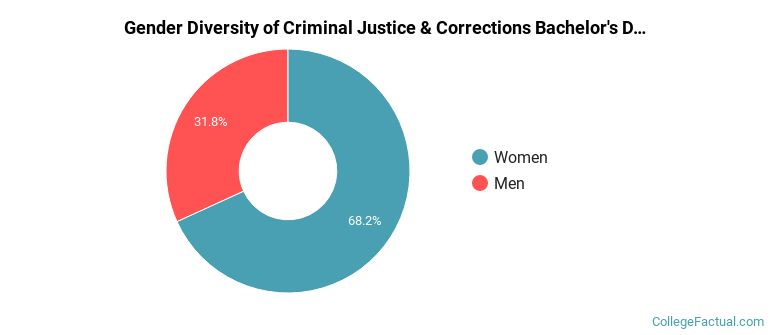
The criminal justice program at UAPB awarded 22 bachelor's degrees in 2021-2022. About 32% of these degrees went to men with the other 68% going to women.
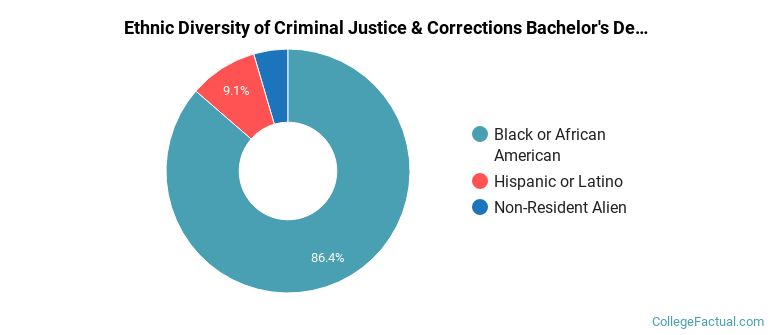
The majority of the bachelor's degree graduates for this major are black or African Americans. About 86% of grads fell into this category.
The following table and chart show the ethnic background for students who recently graduated from University of Arkansas at Pine Bluff with a bachelor's in criminal justice.
| Ethnic Background | Number of Students |
|---|---|
| Asian | 0 |
| Black or African American | 19 |
| Hispanic or Latino | 2 |
| White | 0 |
| Non-Resident Aliens | 1 |
| Other Races | 0 |
UAPB does not offer an online option for its criminal justice bachelor’s degree program at this time. To see if the school offers distance learning options in other areas, visit the UAPB Online Learning page.
Take a look at the following statistics related to the make-up of the criminal justice majors at University of Arkansas at Pine Bluff.