We've gathered data and other essential information about the program, such as the ethnicity of students, how many students graduated in recent times, and more. We've also included details on how UBridgeport ranks compared to other colleges offering a major in me.
Jump to any of the following sections:
The me major at UBridgeport is not ranked on College Factual’s Best Colleges and Universities for Mechanical Engineering. This could be for a number of reasons, such as not having enough data on the major or school to make an accurate assessment of its quality.
During the 2021-2022 academic year, University of Bridgeport handed out 17 bachelor's degrees in mechanical engineering. This is an increase of 55% over the previous year when 11 degrees were handed out.
In 2022, 8 students received their master’s degree in me from UBridgeport. This makes it the #167 most popular school for me master’s degree candidates in the country.
During the 2022-2023 academic year, part-time undergraduate students at UBridgeport paid an average of $1,095 per credit hour. No discount was available for in-state students. The average full-time tuition and fees for undergraduates are shown in the table below.
| In State | Out of State | |
|---|---|---|
| Tuition | $32,860 | $32,860 |
| Fees | $2,900 | $2,900 |
| On Campus Room and Board | $16,350 | $16,350 |
| On Campus Other Expenses | $7,372 | $7,372 |
Learn more about UBridgeport tuition and fees.
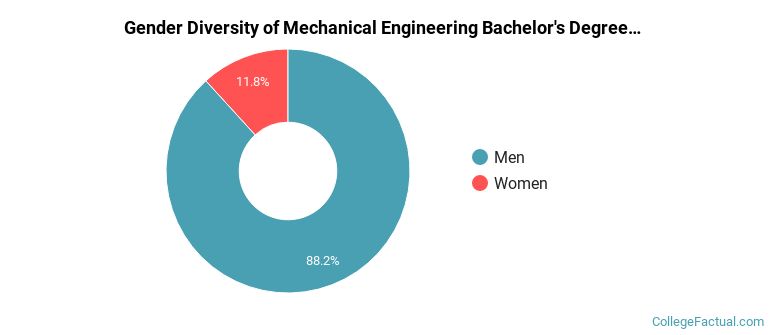
The me program at UBridgeport awarded 17 bachelor's degrees in 2021-2022. About 88% of these degrees went to men with the other 12% going to women.
The following table and chart show the ethnic background for students who recently graduated from University of Bridgeport with a bachelor's in me.
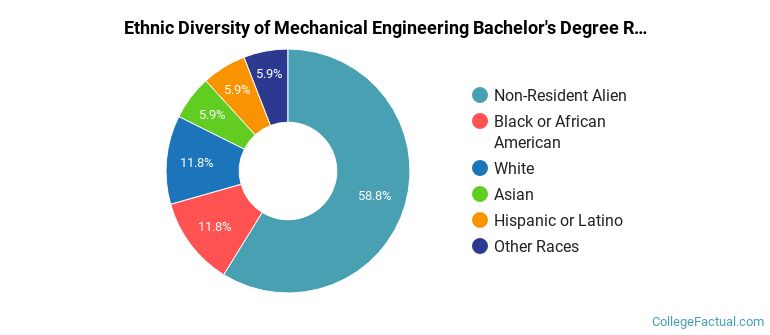
| Ethnic Background | Number of Students |
|---|---|
| Asian | 1 |
| Black or African American | 2 |
| Hispanic or Latino | 1 |
| White | 2 |
| Non-Resident Aliens | 10 |
| Other Races | 1 |
Online degrees for the UBridgeport me bachelor’s degree program are not available at this time. To see if the school offers distance learning options in other areas, visit the UBridgeport Online Learning page.
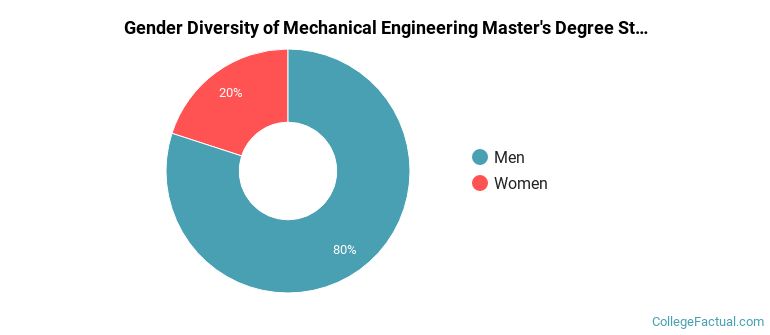
For the most recent academic year available, 80% of me master's degrees went to men and 20% went to women.
The following table and chart show the ethnic background for students who recently graduated from University of Bridgeport with a master's in me.
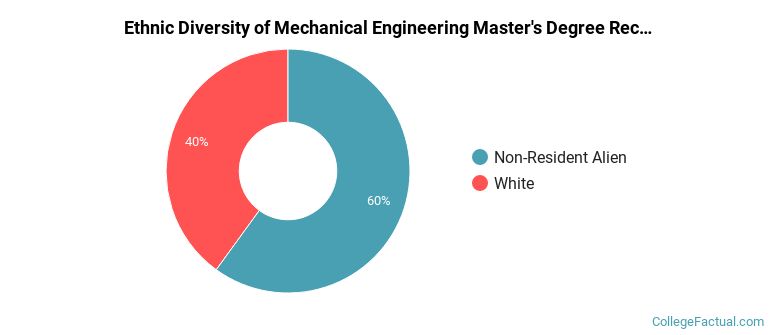
| Ethnic Background | Number of Students |
|---|---|
| Asian | 0 |
| Black or African American | 0 |
| Hispanic or Latino | 0 |
| White | 2 |
| Non-Resident Aliens | 3 |
| Other Races | 0 |
Take a look at the following statistics related to the make-up of the me majors at University of Bridgeport.
| Related Major | Annual Graduates |
|---|---|
| Electrical Engineering | 17 |
| Computer Engineering | 11 |
| Biomedical Engineering | 3 |
More about our data sources and methodologies.