Here, you'll find out more about the major, including such details as the number of graduates, what degree levels are offered, ethnicity of students, average salaries, and more. Also, learn how UBridgeport ranks among other schools offering degrees in dental support.
Go directly to any of the following sections:
The bachelor's program at UBridgeport was ranked #182 on College Factual's Best Schools for dental support list. It is also ranked #3 in Connecticut.
| Ranking Type | Rank |
|---|---|
| Best Dental Support Services Bachelor’s Degree Schools | 51 |
| Best Dental Support Services Associate Degree Schools | 139 |
| Best Dental Support Services Schools | 182 |
During the 2021-2022 academic year, University of Bridgeport handed out 36 bachelor's degrees in dental support services. This is a decrease of 23% over the previous year when 47 degrees were handed out.
In 2022, 13 students received their master’s degree in dental support from UBridgeport. This makes it the #4 most popular school for dental support master’s degree candidates in the country.
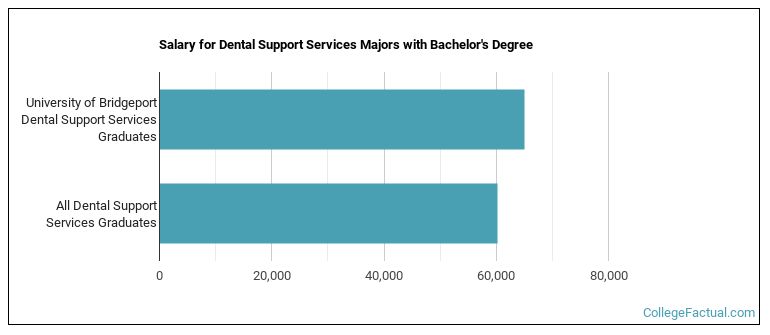
The median salary of dental support students who receive their bachelor's degree at UBridgeport is $65,025. This is higher than $60,171, which is the national median for all dental support bachelor's degree recipients.
In 2022-2023, the average part-time undergraduate tuition at UBridgeport was $1,095 per credit hour for both in-state and out-of-state students. The average full-time tuition and fees for undergraduates are shown in the table below.
| In State | Out of State | |
|---|---|---|
| Tuition | $32,860 | $32,860 |
| Fees | $2,900 | $2,900 |
| On Campus Room and Board | $16,350 | $16,350 |
| On Campus Other Expenses | $7,372 | $7,372 |
Learn more about UBridgeport tuition and fees.
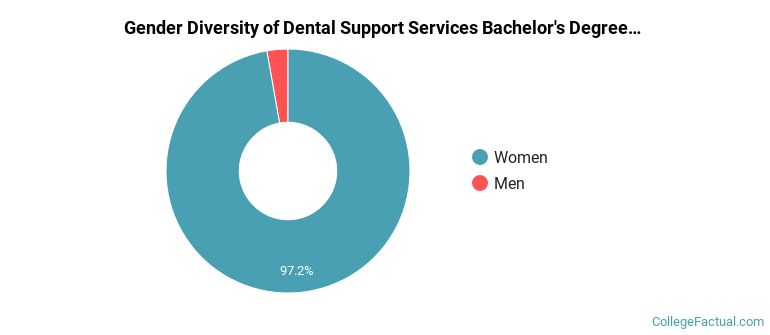
Of the 36 students who earned a bachelor's degree in Dental Support Services from UBridgeport in 2021-2022, 3% were men and 97% were women.
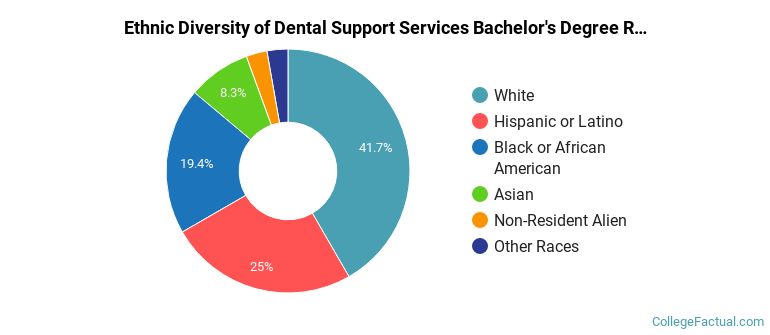
The following table and chart show the ethnic background for students who recently graduated from University of Bridgeport with a bachelor's in dental support.
| Ethnic Background | Number of Students |
|---|---|
| Asian | 3 |
| Black or African American | 7 |
| Hispanic or Latino | 9 |
| White | 15 |
| Non-Resident Aliens | 1 |
| Other Races | 1 |
UBridgeport does not offer an online option for its dental support bachelor’s degree program at this time. To see if the school offers distance learning options in other areas, visit the UBridgeport Online Learning page.
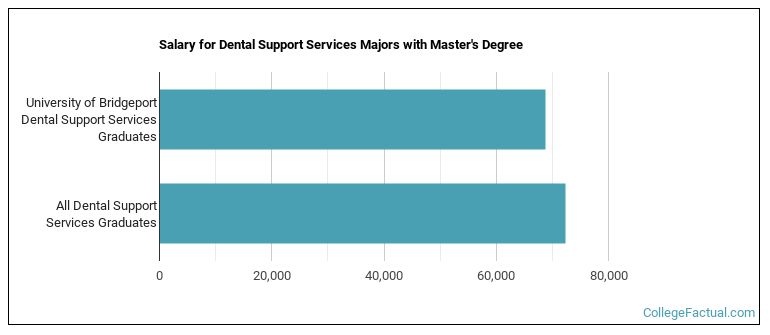
Graduates of the master's dental support program at UBridgeport make a median salary of $68,774. This is less than what their typical peers from other schools make. Their median salary is $72,323.
All of the 14 students who graduated with a Master’s in dental support from UBridgeport in 2022 were women.

The majority of master's degree recipients in this major at UBridgeport are white. In the most recent graduating class for which data is available, 71% of students fell into this category.
The following table and chart show the ethnic background for students who recently graduated from University of Bridgeport with a master's in dental support.
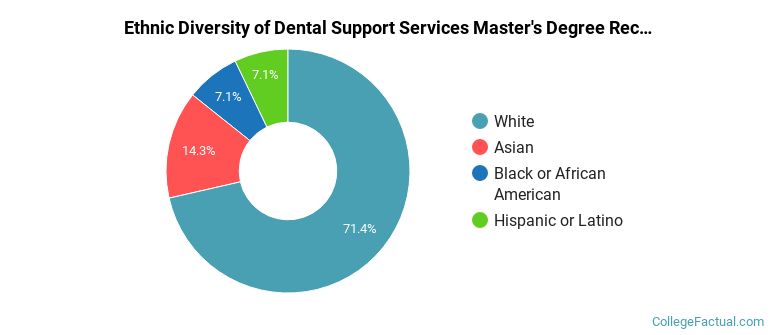
| Ethnic Background | Number of Students |
|---|---|
| Asian | 2 |
| Black or African American | 1 |
| Hispanic or Latino | 1 |
| White | 10 |
| Non-Resident Aliens | 0 |
| Other Races | 0 |
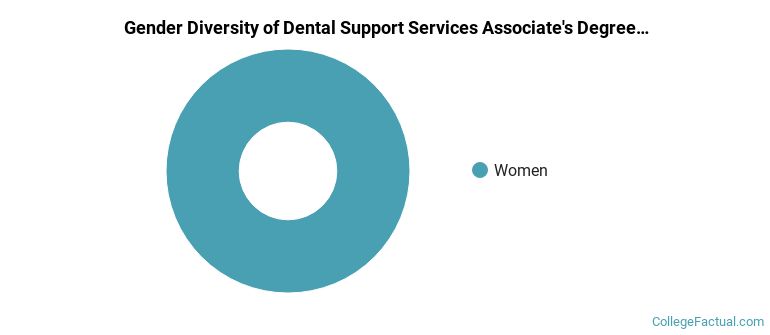
All of the 35 students who graduated with a Associate’s in dental support from UBridgeport in 2022 were women.
The following table and chart show the ethnic background for students who recently graduated from University of Bridgeport with a associate's in dental support.
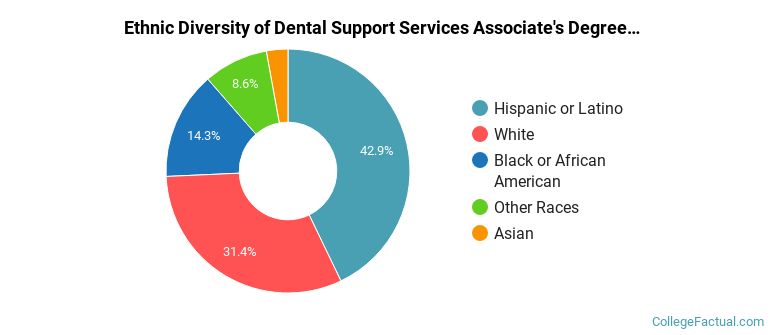
| Ethnic Background | Number of Students |
|---|---|
| Asian | 1 |
| Black or African American | 5 |
| Hispanic or Latino | 15 |
| White | 11 |
| Non-Resident Aliens | 0 |
| Other Races | 3 |
Take a look at the following statistics related to the make-up of the dental support majors at University of Bridgeport.
| Related Major | Annual Graduates |
|---|---|
| Nursing | 140 |
| Chiropractic | 40 |
| Allied Health Professions | 38 |
| Other Health Professions | 30 |
| Public Health | 29 |
More about our data sources and methodologies.