Go directly to any of the following sections:
In College Factual's most recent rankings for the best schools for physical sciences majors, UCSB came in at #6. This puts it in the top 5% of the country in this field of study. It is also ranked #2 in California.
During the 2021-2022 academic year, University of California - Santa Barbara handed out 314 bachelor's degrees in physical sciences. This is an increase of 6% over the previous year when 296 degrees were handed out.
In 2022, 49 students received their master’s degree in physical sciences from UCSB. This makes it the #35 most popular school for physical sciences master’s degree candidates in the country.
In addition, 55 students received their doctoral degrees in physical sciences in 2022, making the school the #30 most popular school in the United States for this category of students.
The following table shows the average full-time tuition and fees for undergraduates.
| In State | Out of State | |
|---|---|---|
| Tuition | $11,834 | $42,611 |
| Fees | $3,131 | $3,131 |
| Books and Supplies | $1,482 | $1,482 |
| On Campus Room and Board | $18,684 | $18,684 |
| On Campus Other Expenses | $5,456 | $5,456 |
Learn more about UCSB tuition and fees.
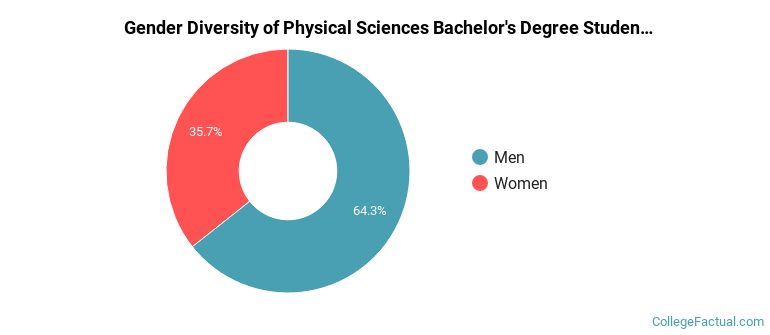
During the 2021-2022 academic year, 314 students graduated with a bachelor's degree in physical sciences from UCSB. About 64% were men and 36% were women.
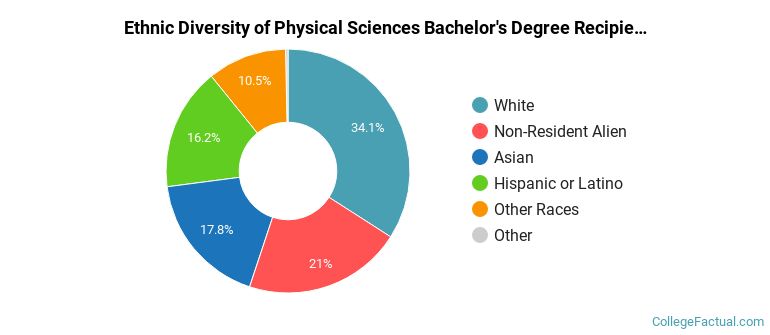
The following table and chart show the ethnic background for students who recently graduated from University of California - Santa Barbara with a bachelor's in physical sciences.
| Ethnic Background | Number of Students |
|---|---|
| Asian | 56 |
| Black or African American | 1 |
| Hispanic or Latino | 51 |
| White | 107 |
| Non-Resident Aliens | 66 |
| Other Races | 33 |
UCSB does not offer an online option for its physical sciences bachelor’s degree program at this time. To see if the school offers distance learning options in other areas, visit the UCSB Online Learning page.
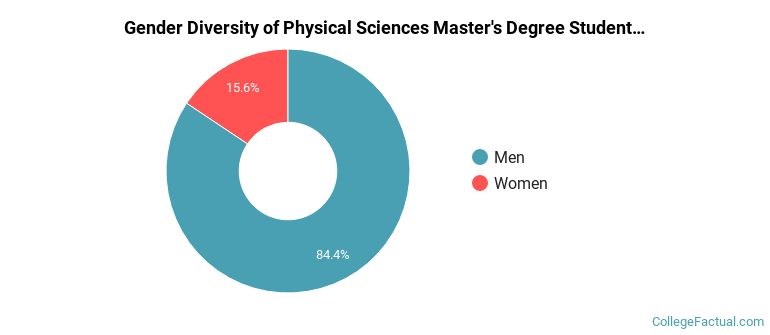
During the 2021-2022 academic year, 32 students graduated with a master's degree in physical sciences from UCSB. About 84% were men and 16% were women.
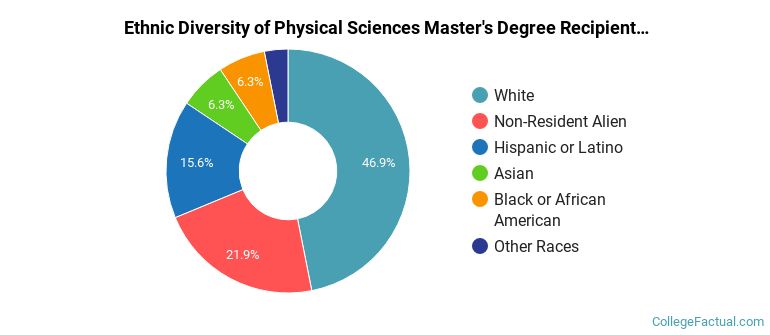
The following table and chart show the ethnic background for students who recently graduated from University of California - Santa Barbara with a master's in physical sciences.
| Ethnic Background | Number of Students |
|---|---|
| Asian | 2 |
| Black or African American | 2 |
| Hispanic or Latino | 5 |
| White | 15 |
| Non-Resident Aliens | 7 |
| Other Races | 1 |
Take a look at the following statistics related to the make-up of the physical sciences majors at University of California - Santa Barbara.
Physical Sciences students may decide to major in one of the following focus areas. Individual majors may not be available for all degree levels.
| Major | Annual Graduates |
|---|---|
| Physics | 194 |
| Chemistry | 147 |
| Geological & Earth Sciences | 59 |
| Materials Sciences | 31 |
| Related Major | Annual Graduates |
|---|---|
| Biological & Biomedical Sciences | 761 |
| Mathematics & Statistics | 686 |
| Natural Resources & Conservation | 406 |
| Engineering | 394 |
More about our data sources and methodologies.