We've pulled together some essential information you should know about the program, including how many students graduate each year, the ethnic diversity of these students, average starting salaries, and more. Also, learn how UChicago ranks among other schools offering degrees in political science.
Go directly to any of the following sections:
Learn about start dates, transferring credits, availability of financial aid, and more by contacting the universities below.
Gain a solid understanding of American political history, the current political landscape, and the major political parties with this online bachelor's from Southern New Hampshire University.
In College Factual's most recent rankings for the best schools for political science majors, UChicago came in at #7. This puts it in the top 5% of the country in this field of study. It is also ranked #1 in Illinois.
During the 2021-2022 academic year, University of Chicago handed out 109 bachelor's degrees in political science & government. Last year, the same number of degrees were handed out.
In 2022, 12 students received their master’s degree in political science from UChicago. This makes it the #36 most popular school for political science master’s degree candidates in the country.
In addition, 18 students received their doctoral degrees in political science in 2022, making the school the #3 most popular school in the United States for this category of students.
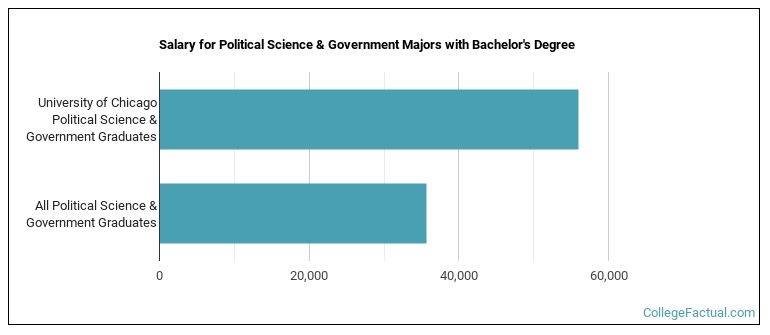
The median salary of political science students who receive their bachelor's degree at UChicago is $56,022. This is great news for graduates of the program, since this figure is higher than the national average of $35,631 for all political science bachelor's degree recipients.
During the 2022-2023 academic year, part-time undergraduate students at UChicago paid an average of $2,127 per credit hour. No discount was available for in-state students. The average full-time tuition and fees for undergraduates are shown in the table below.
| In State | Out of State | |
|---|---|---|
| Tuition | $63,801 | $63,801 |
| Fees | $1,818 | $1,818 |
| Books and Supplies | $1,800 | $1,800 |
| On Campus Room and Board | $19,221 | $19,221 |
| On Campus Other Expenses | $2,400 | $2,400 |
Learn more about UChicago tuition and fees.
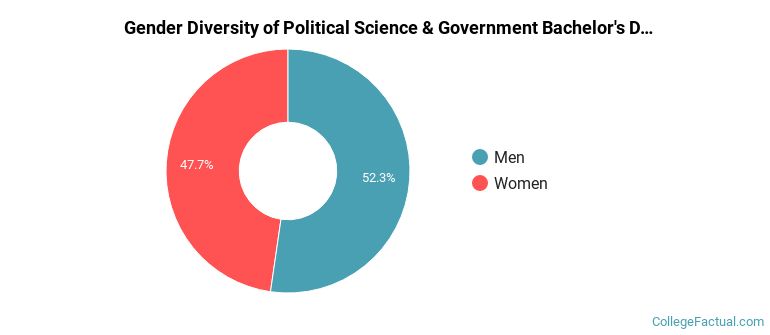
Of the 109 political science students who graduated with a bachelor's degree in 2021-2022 from UChicago, about 52% were men and 48% were women.
The following table and chart show the ethnic background for students who recently graduated from University of Chicago with a bachelor's in political science.
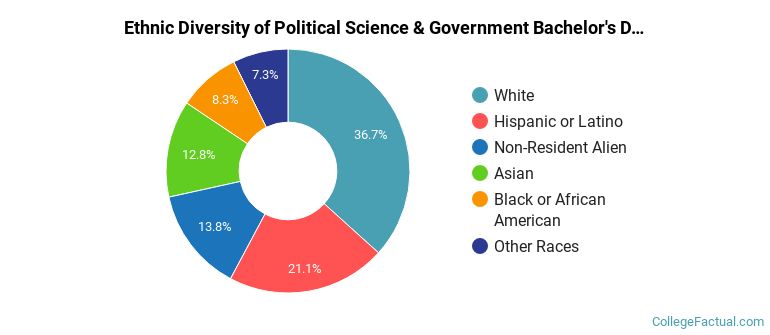
| Ethnic Background | Number of Students |
|---|---|
| Asian | 14 |
| Black or African American | 9 |
| Hispanic or Latino | 23 |
| White | 40 |
| Non-Resident Aliens | 15 |
| Other Races | 8 |
UChicago does not offer an online option for its political science bachelor’s degree program at this time. To see if the school offers distance learning options in other areas, visit the UChicago Online Learning page.
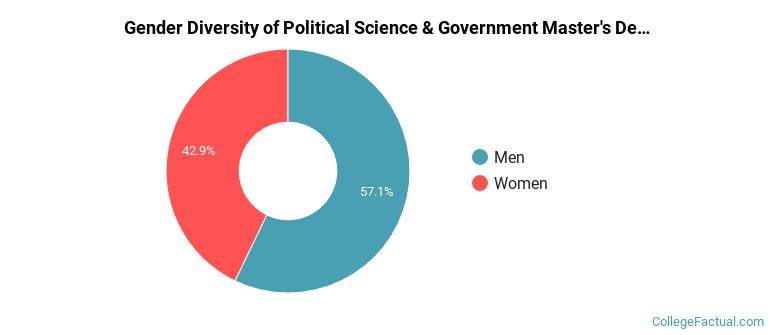
During the 2021-2022 academic year, 7 political science majors earned their master's degree from UChicago. Of these graduates, 57% were men and 43% were women.
The majority of master's degree recipients in this major at UChicago are white. In the most recent graduating class for which data is available, 57% of students fell into this category.
The following table and chart show the ethnic background for students who recently graduated from University of Chicago with a master's in political science.
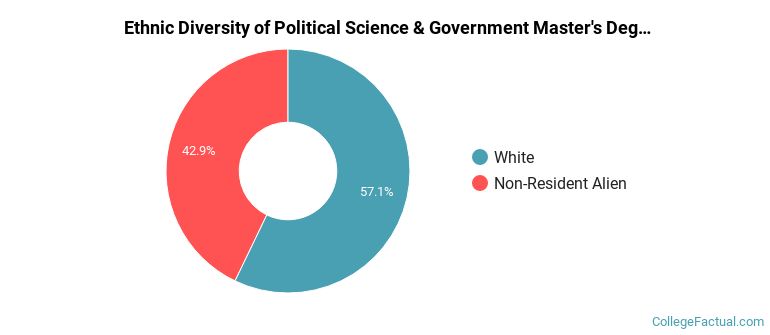
| Ethnic Background | Number of Students |
|---|---|
| Asian | 0 |
| Black or African American | 0 |
| Hispanic or Latino | 0 |
| White | 4 |
| Non-Resident Aliens | 3 |
| Other Races | 0 |
Take a look at the following statistics related to the make-up of the political science majors at University of Chicago.
| Related Major | Annual Graduates |
|---|---|
| Economics | 777 |
| General Social Sciences | 227 |
| International Relations & National Security | 163 |
| Sociology | 67 |
| Anthropology | 56 |
More about our data sources and methodologies.
