Go directly to any of the following sections:
The engineering tech major at UC Clermont College is not ranked on College Factual’s Best Colleges and Universities for Engineering Technologies. This could be for a number of reasons, such as not having enough data on the major or school to make an accurate assessment of its quality.
During the 2022-2023 academic year, part-time undergraduate students at UC Clermont College paid an average of $615 per credit hour if they came to the school from out-of-state. In-state students paid a discounted rate of $249 per credit hour. The following table shows the average full-time tuition and fees for undergraduates.
| In State | Out of State | |
|---|---|---|
| Tuition | $5,712 | $12,944 |
| Fees | $736 | $736 |
| Books and Supplies | $1,300 | $1,300 |
Learn more about UC Clermont College tuition and fees.
Online degrees for the UC Clermont College engineering tech bachelor’s degree program are not available at this time. To see if the school offers distance learning options in other areas, visit the UC Clermont College Online Learning page.
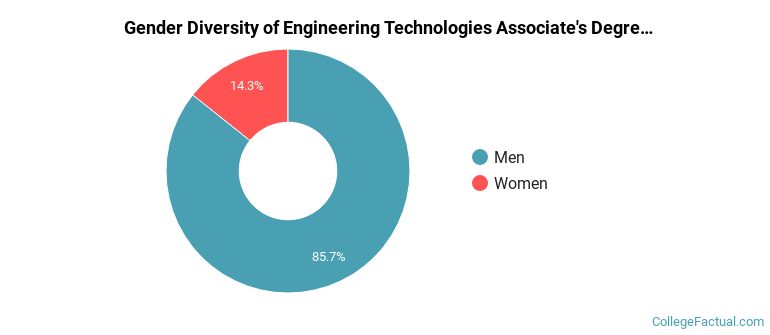
The engineering tech program at UC Clermont College awarded 14 associate's degrees in 2021-2022. About 86% of these degrees went to men with the other 14% going to women.
The majority of the students with this major are white. About 79% of 2022 graduates were in this category.
The following table and chart show the ethnic background for students who recently graduated from University of Cincinnati - Clermont College with a associate's in engineering tech.
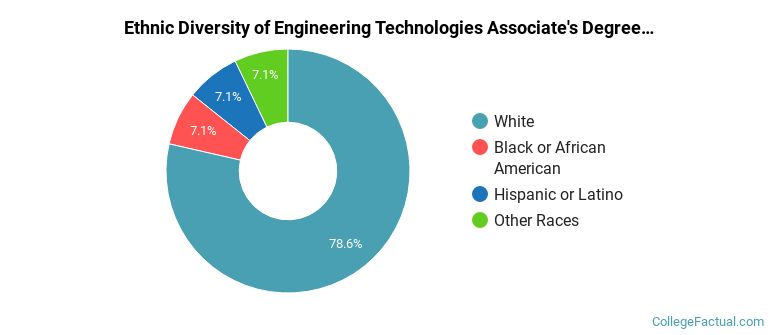
| Ethnic Background | Number of Students |
|---|---|
| Asian | 0 |
| Black or African American | 1 |
| Hispanic or Latino | 1 |
| White | 11 |
| Non-Resident Aliens | 0 |
| Other Races | 1 |
Engineering Technologies students may decide to major in one of the following focus areas. Individual majors may not be available for all degree levels.
| Major | Annual Graduates |
|---|---|
| Industrial Production Technology | 8 |
| Computer Engineering Technology | 6 |
| Related Major | Annual Graduates |
|---|---|
| Biological & Biomedical Sciences | 23 |
| Physical Sciences | 11 |
| Natural Resources & Conservation | 4 |