UC total enrollment is approximately 40,826 students. 24,301 are undergraduates and 5,516 are graduate students.
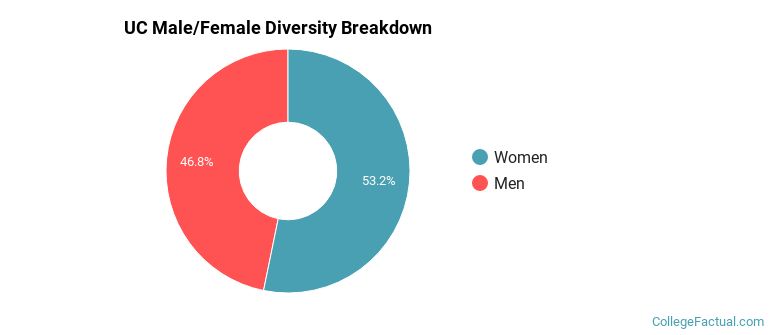
Male/Female Breakdown of Undergraduates
The full-time UC undergraduate population is made up of 48% women, and 52% men.

For the gender breakdown for all students, go here.
UC Racial/Ethnic Breakdown of Undergraduates

| Race/Ethnicity | Number |
|---|---|
| White | 18,467 |
| Black or African American | 1,448 |
| Asian | 1,168 |
| Multi-Ethnic | 1,027 |
| International | 1,013 |
| Hispanic | 865 |
| Unknown | 288 |
| Native Hawaiian or Pacific Islander | 9 |
See racial/ethnic breakdown for all students.
Male/Female Breakdown of Graduate Students
About 57% of full-time grad students are women, and 43% men.

For the gender breakdown for all students, go here.
UC Racial-Ethnic Breakdown of Graduate Students

| Race/Ethnicity | Number |
|---|---|
| White | 3,229 |
| International | 1,006 |
| Black or African American | 410 |
| Asian | 294 |
| Hispanic | 272 |
| Multi-Ethnic | 167 |
| Unknown | 130 |
| Native Hawaiian or Pacific Islander | 2 |
See racial/ethnic breakdown for all students.

| Race/Ethnicity | Number |
|---|---|
| White | 28,664 |
| International | 2,968 |
| Black or African American | 2,928 |
| Asian | 1,988 |
| Hispanic | 1,616 |
| Multi-Ethnic | 1,546 |
| Unknown | 1,054 |
| Native Hawaiian or Pacific Islander | 21 |
There are approximately 21,857 female students and 18,969 male students at UC.
UC ranks 844 out of 2,183 when it comes to geographic diversity.
14.09% of UC students come from out of state, and 2.97% come from out of the country.

The undergraduate student body is split among 35 states (may include Washington D.C.). Click on the map for more detail.

| State | Amount |
|---|---|
| Ohio | 4,174 |
| Kentucky | 280 |
| Indiana | 153 |
| Illinois | 35 |
| Michigan | 30 |
Students from 107 countries are represented at this school, with the majority of the international students coming from India, China, and South Korea.
Learn more about international students at UC.
A traditional college student is defined as being between the ages of 18-21. At UC, 49.65% of students fall into that category, compared to the national average of 60%.

| Student Age Group | Amount |
|---|---|
| 18-19 | 9,485 |
| 20-21 | 8,961 |
| 22-24 | 7,426 |
| 25-29 | 4,829 |
| 35 and over | 3,376 |
| 30-34 | 2,225 |
| Under 18 | 0 |
Footnotes
*The racial-ethnic minorities count is calculated by taking the total number of students and subtracting white students, international students, and students whose race/ethnicity was unknown. This number is then divided by the total number of students at the school to obtain the racial-ethnic minorities percentage.
References
Department of Homeland Security Citizenship and Immigration Services
Find out how College Factual created their Diversity Rankings.