UDayton total enrollment is approximately 11,650 students. 8,314 are undergraduates and 2,145 are graduate students.
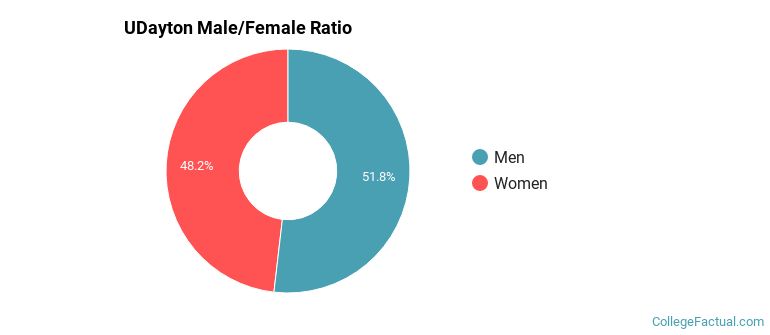
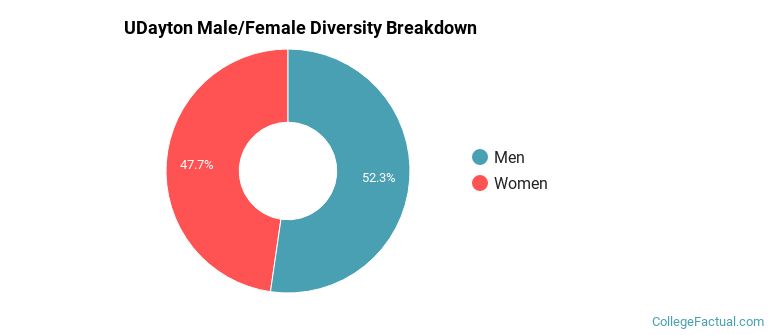
Male/Female Breakdown of Undergraduates
The full-time UDayton undergraduate population is made up of 49% women, and 51% men.
For the gender breakdown for all students, go here.
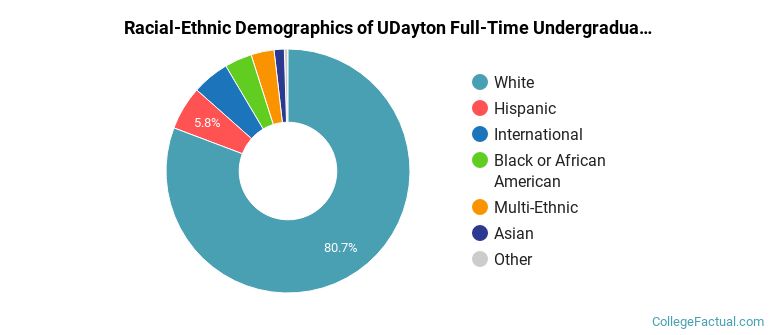
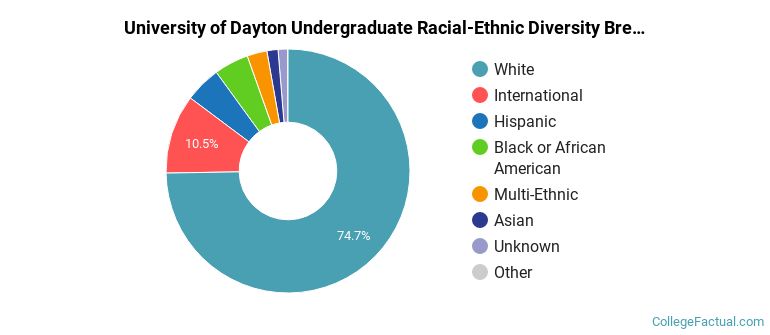
UDayton Racial/Ethnic Breakdown of Undergraduates
| Race/Ethnicity | Number |
|---|---|
| White | 6,672 |
| Hispanic | 549 |
| Black or African American | 370 |
| International | 289 |
| Multi-Ethnic | 277 |
| Asian | 122 |
| Unknown | 27 |
| Native Hawaiian or Pacific Islander | 4 |
See racial/ethnic breakdown for all students.
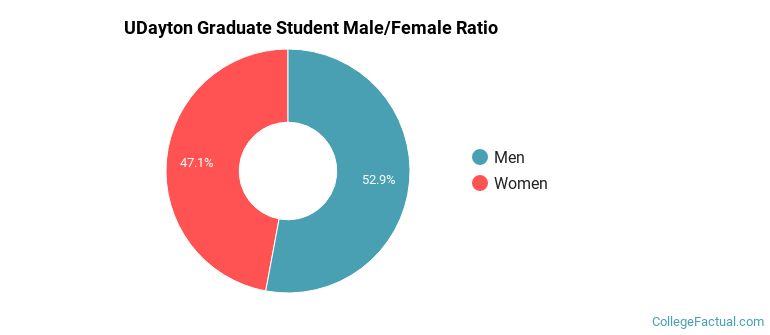
Male/Female Breakdown of Graduate Students
About 51% of full-time grad students are women, and 49% men.
For the gender breakdown for all students, go here.
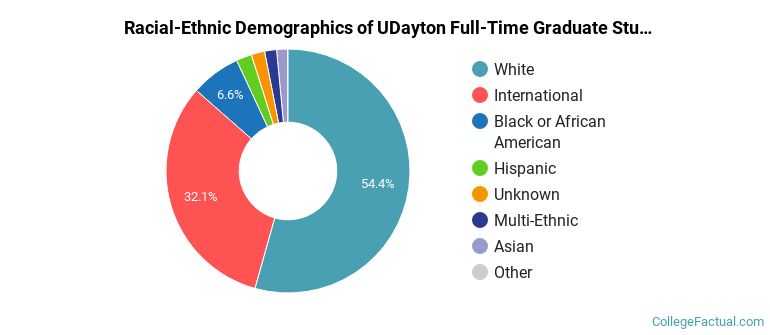
UDayton Racial-Ethnic Breakdown of Graduate Students
| Race/Ethnicity | Number |
|---|---|
| White | 1,202 |
| International | 579 |
| Black or African American | 177 |
| Hispanic | 52 |
| Unknown | 50 |
| Multi-Ethnic | 42 |
| Asian | 36 |
| Native Hawaiian or Pacific Islander | 2 |
See racial/ethnic breakdown for all students.
| Race/Ethnicity | Number |
|---|---|
| White | 8,707 |
| International | 986 |
| Hispanic | 637 |
| Black or African American | 624 |
| Multi-Ethnic | 342 |
| Asian | 185 |
| Unknown | 152 |
| Native Hawaiian or Pacific Islander | 7 |
There are approximately 5,708 female students and 5,942 male students at UDayton.
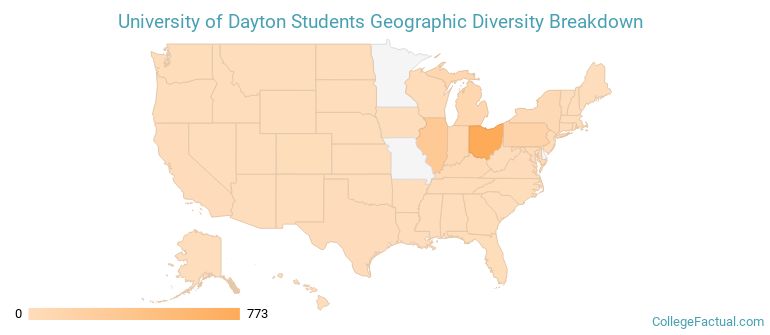
UDayton ranks 380 out of 2,183 when it comes to geographic diversity.
55.55% of UDayton students come from out of state, and 3.67% come from out of the country.
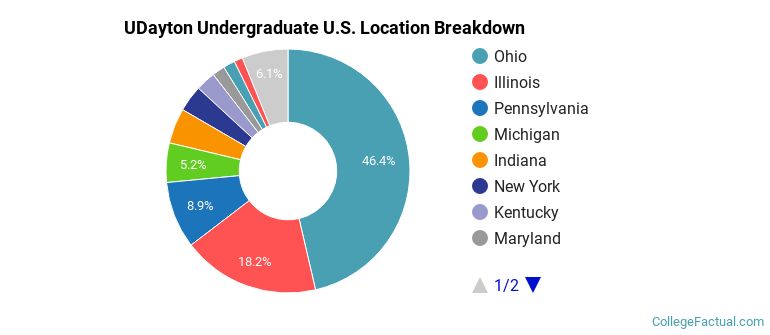
The undergraduate student body is split among 30 states (may include Washington D.C.). Click on the map for more detail.
| State | Amount |
|---|---|
| Ohio | 773 |
| Illinois | 304 |
| Pennsylvania | 148 |
| Michigan | 87 |
| Indiana | 78 |
Students from 72 countries are represented at this school, with the majority of the international students coming from China, Saudi Arabia, and India.
Learn more about international students at UDayton.
A traditional college student is defined as being between the ages of 18-21. At UDayton, 68.05% of students fall into that category, compared to the national average of 60%.
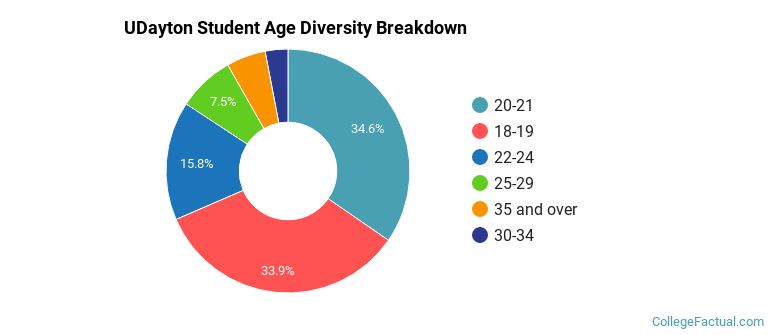
| Student Age Group | Amount |
|---|---|
| 20-21 | 3,742 |
| 18-19 | 3,663 |
| 22-24 | 1,704 |
| 25-29 | 812 |
| 35 and over | 564 |
| 30-34 | 326 |
| Under 18 | 0 |
Footnotes
*The racial-ethnic minorities count is calculated by taking the total number of students and subtracting white students, international students, and students whose race/ethnicity was unknown. This number is then divided by the total number of students at the school to obtain the racial-ethnic minorities percentage.
References
Department of Homeland Security Citizenship and Immigration Services
Learn more about how College Factual creates their Diversity Rankings.