UGA total enrollment is approximately 39,147 students. 27,888 are undergraduates and 7,063 are graduate students.
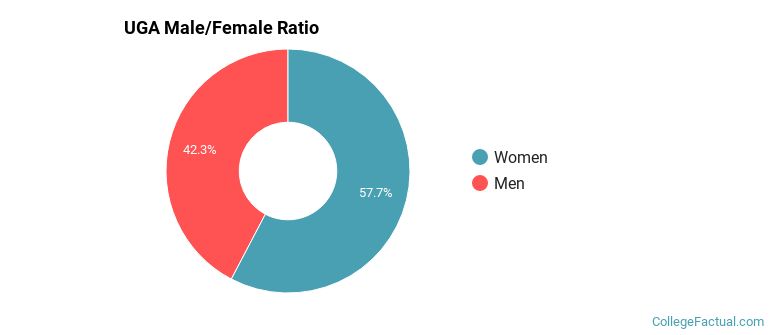
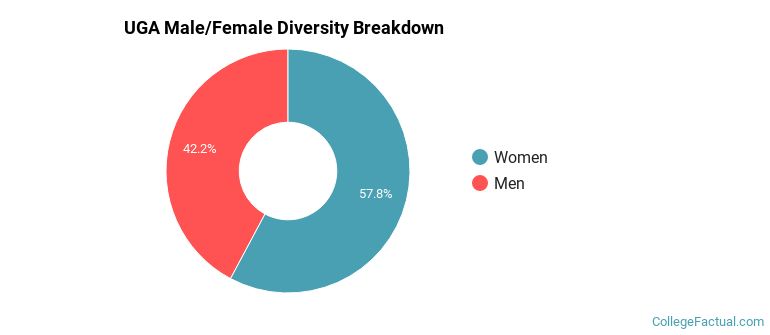
Male/Female Breakdown of Undergraduates
The full-time UGA undergraduate population is made up of 58% women, and 42% men.
For the gender breakdown for all students, go here.
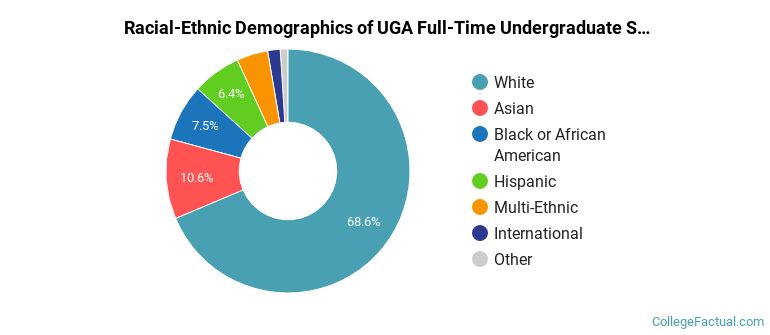
UGA Racial/Ethnic Breakdown of Undergraduates
| Race/Ethnicity | Number |
|---|---|
| White | 19,112 |
| Asian | 3,030 |
| Black or African American | 1,988 |
| Hispanic | 1,907 |
| Multi-Ethnic | 1,193 |
| International | 332 |
| Unknown | 285 |
| Native Hawaiian or Pacific Islander | 22 |
See racial/ethnic breakdown for all students.
Male/Female Breakdown of Graduate Students
About 60% of full-time grad students are women, and 40% men.

For the gender breakdown for all students, go here.
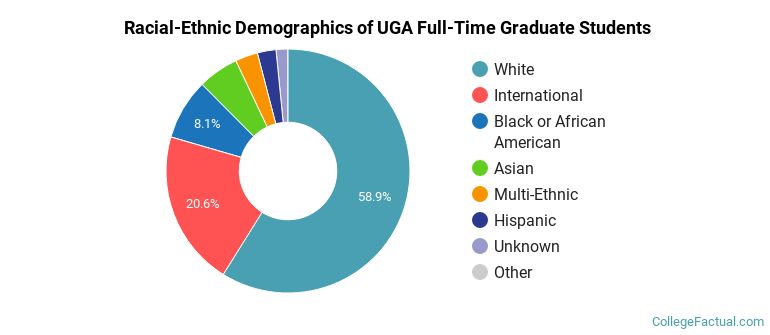
UGA Racial-Ethnic Breakdown of Graduate Students
| Race/Ethnicity | Number |
|---|---|
| White | 4,243 |
| International | 1,273 |
| Black or African American | 632 |
| Asian | 366 |
| Multi-Ethnic | 254 |
| Hispanic | 168 |
| Unknown | 104 |
| Native Hawaiian or Pacific Islander | 2 |
See racial/ethnic breakdown for all students.
| Race/Ethnicity | Number |
|---|---|
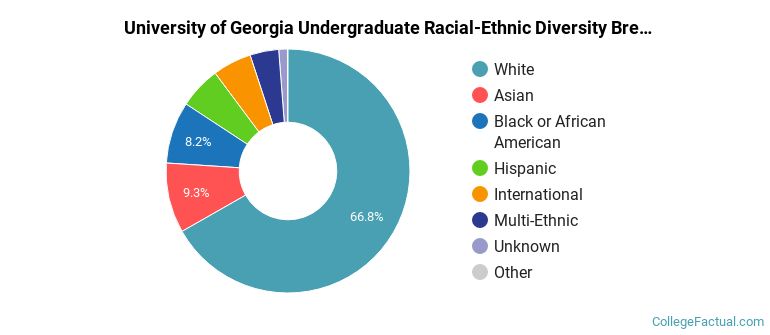
| White | 26,121 |
| Asian | 3,711 |
| Black or African American | 3,218 |
| Hispanic | 2,241 |
| International | 1,731 |
| Multi-Ethnic | 1,589 |
| Unknown | 463 |
| Native Hawaiian or Pacific Islander | 28 |
There are approximately 22,890 female students and 16,257 male students at UGA.
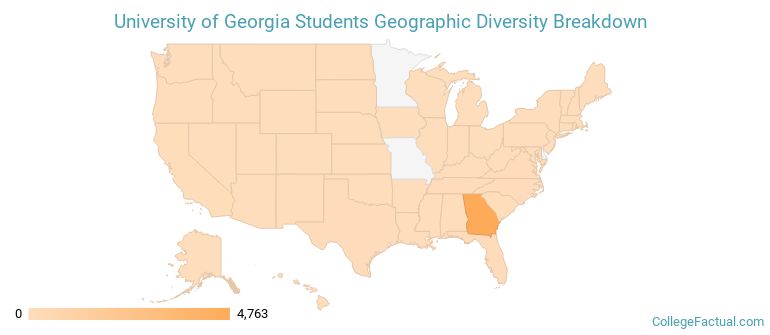
UGA ranks 733 out of 2,183 when it comes to geographic diversity.
11.3% of UGA students come from out of state, and 1.16% come from out of the country.
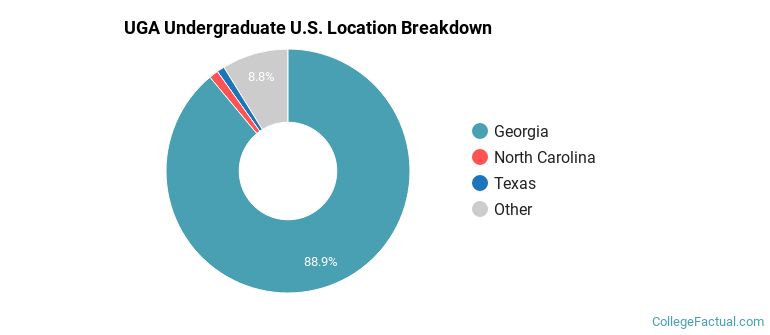
The undergraduate student body is split among 40 states (may include Washington D.C.). Click on the map for more detail.
| State | Amount |
|---|---|
| Georgia | 4,763 |
| North Carolina | 66 |
| Texas | 54 |
| Florida | 53 |
| Tennessee | 51 |
Students from 98 countries are represented at this school, with the majority of the international students coming from China, India, and South Korea.
Learn more about international students at UGA.
A traditional college student is defined as being between the ages of 18-21. At UGA, 62.28% of students fall into that category, compared to the national average of 60%.
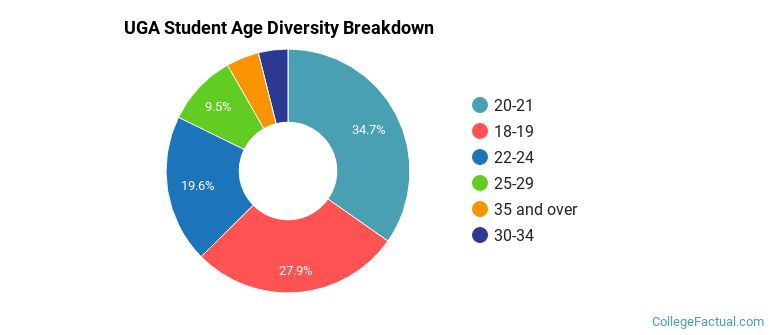
| Student Age Group | Amount |
|---|---|
| 20-21 | 12,992 |
| 18-19 | 10,428 |
| 22-24 | 7,349 |
| 25-29 | 3,546 |
| 35 and over | 1,628 |
| 30-34 | 1,468 |
| Under 18 | 0 |
Footnotes
*The racial-ethnic minorities count is calculated by taking the total number of students and subtracting white students, international students, and students whose race/ethnicity was unknown. This number is then divided by the total number of students at the school to obtain the racial-ethnic minorities percentage.
References