UIC total enrollment is approximately 33,518 students. 20,023 are undergraduates and 8,032 are graduate students.
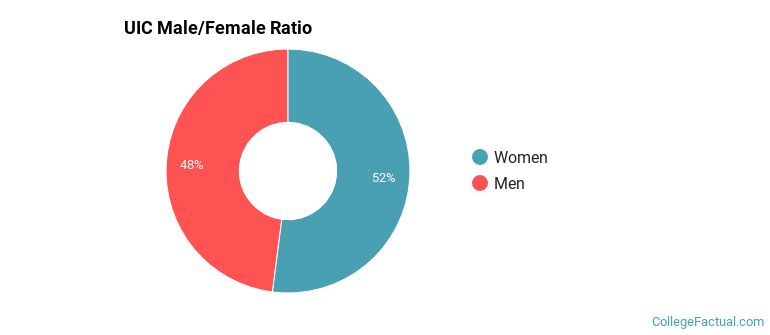
Male/Female Breakdown of Undergraduates
The full-time UIC undergraduate population is made up of 53% women, and 47% men.
For the gender breakdown for all students, go here.
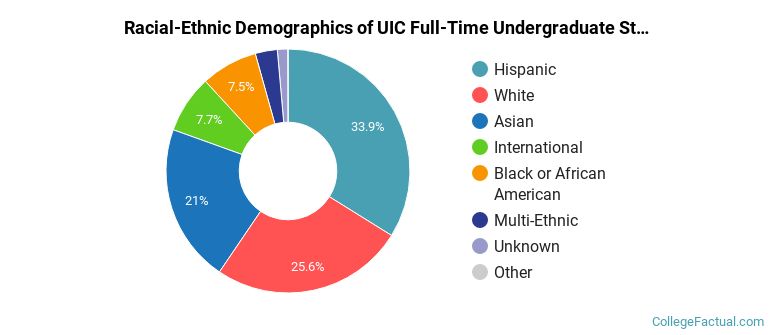
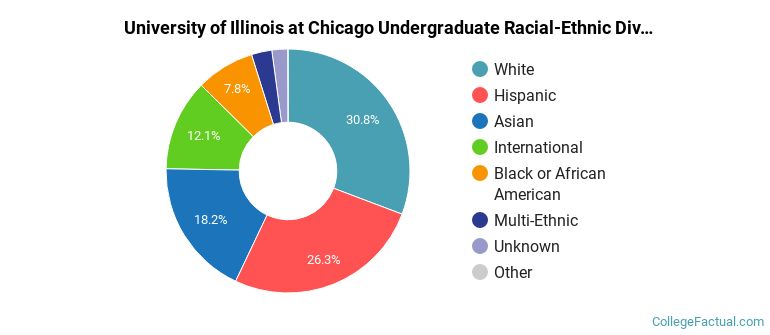
UIC Racial/Ethnic Breakdown of Undergraduates
| Race/Ethnicity | Number |
|---|---|
| Hispanic | 6,916 |
| White | 4,951 |
| Asian | 4,267 |
| Black or African American | 1,510 |
| International | 1,493 |
| Multi-Ethnic | 595 |
| Unknown | 278 |
| Native Hawaiian or Pacific Islander | 7 |
See racial/ethnic breakdown for all students.
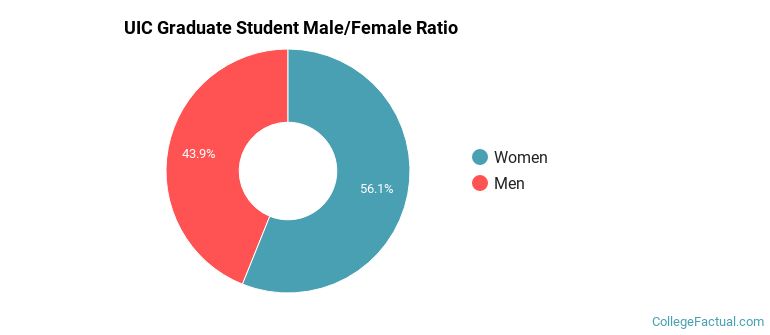
Male/Female Breakdown of Graduate Students
About 57% of full-time grad students are women, and 43% men.
For the gender breakdown for all students, go here.
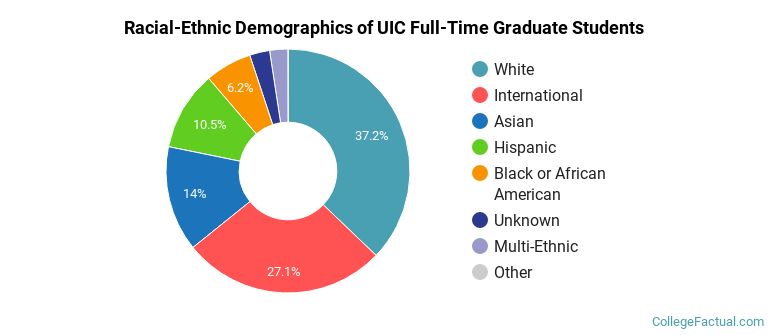
UIC Racial-Ethnic Breakdown of Graduate Students
| Race/Ethnicity | Number |
|---|---|
| White | 3,224 |
| International | 1,637 |
| Asian | 1,089 |
| Hispanic | 955 |
| Black or African American | 587 |
| Unknown | 305 |
| Multi-Ethnic | 218 |
| Native Hawaiian or Pacific Islander | 5 |
See racial/ethnic breakdown for all students.
| Race/Ethnicity | Number |
|---|---|
| White | 10,487 |
| Hispanic | 9,014 |
| Asian | 6,042 |
| International | 3,483 |
| Black or African American | 2,708 |
| Multi-Ethnic | 934 |
| Unknown | 815 |
| Native Hawaiian or Pacific Islander | 13 |

There are approximately 18,360 female students and 15,158 male students at UIC.
UIC ranks 1,187 out of 2,183 when it comes to geographic diversity.
4.48% of UIC students come from out of state, and 2.75% come from out of the country.
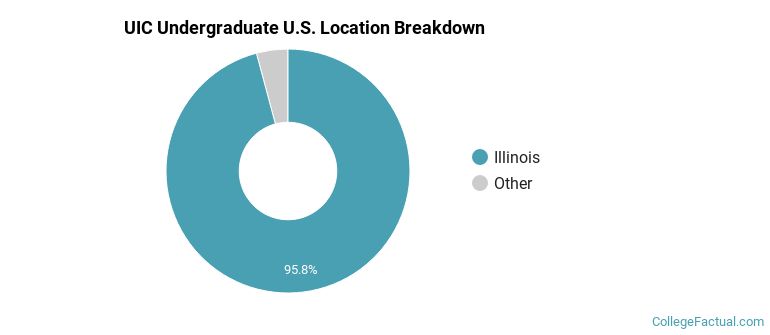
The undergraduate student body is split among 32 states (may include Washington D.C.). Click on the map for more detail.
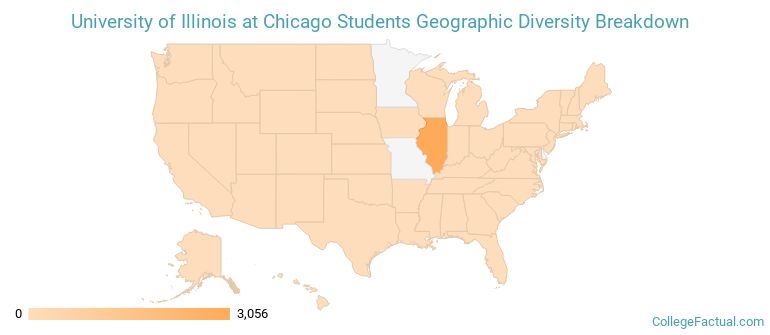
| State | Amount |
|---|---|
| Illinois | 3,056 |
| Michigan | 13 |
| Indiana | 12 |
| Wisconsin | 12 |
| California | 9 |
Students from 98 countries are represented at this school, with the majority of the international students coming from India, China, and Iran.
Learn more about international students at UIC.
A traditional college student is defined as being between the ages of 18-21. At UIC, 44.96% of students fall into that category, compared to the national average of 60%.
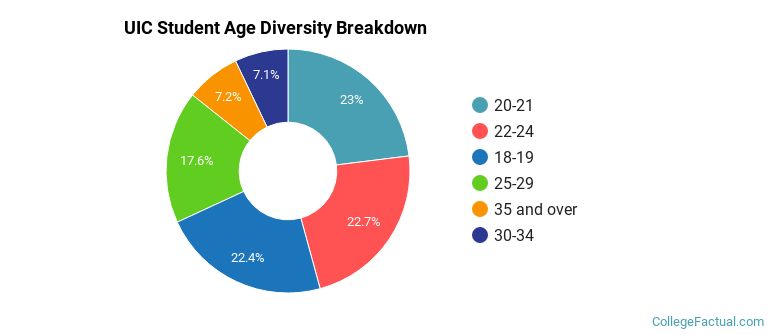
| Student Age Group | Amount |
|---|---|
| 20-21 | 6,967 |
| 22-24 | 6,876 |
| 18-19 | 6,764 |
| 25-29 | 5,320 |
| 35 and over | 2,184 |
| 30-34 | 2,144 |
| Under 18 | 0 |
Footnotes
*The racial-ethnic minorities count is calculated by taking the total number of students and subtracting white students, international students, and students whose race/ethnicity was unknown. This number is then divided by the total number of students at the school to obtain the racial-ethnic minorities percentage.
References
Department of Homeland Security Citizenship and Immigration Services
Learn more about how College Factual creates their Diversity Rankings.