Go directly to any of the following sections:
The bachelor's program at UofL was ranked #324 on College Factual's Best Schools for visual & performing arts list. It is also ranked #2 in Kentucky.
During the 2021-2022 academic year, University of Louisville handed out 86 bachelor's degrees in visual & performing arts. This is a decrease of 8% over the previous year when 93 degrees were handed out.
In 2022, 34 students received their master’s degree in visual & performing arts from UofL. This makes it the #127 most popular school for visual & performing arts master’s degree candidates in the country.
In 2022-2023, the average part-time undergraduate tuition at UofL was $1,208 per credit hour for out-of-state students. The average for in-state students was $527 per credit hour. The following table shows the average full-time tuition and fees for undergraduates.
| In State | Out of State | |
|---|---|---|
| Tuition | $12,632 | $28,978 |
| Fees | $196 | $196 |
| Books and Supplies | $1,274 | $1,274 |
| On Campus Room and Board | $11,690 | $11,690 |
| On Campus Other Expenses | $7,914 | $7,914 |
Learn more about UofL tuition and fees.
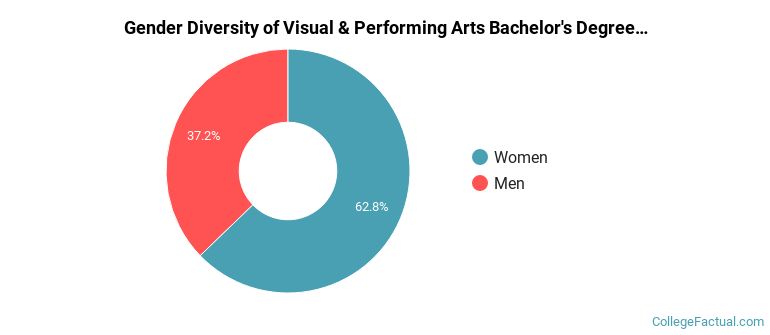
Of the 86 students who graduated with a Bachelor’s in visual & performing arts from UofL in 2022, 37% were men and 63% were women.
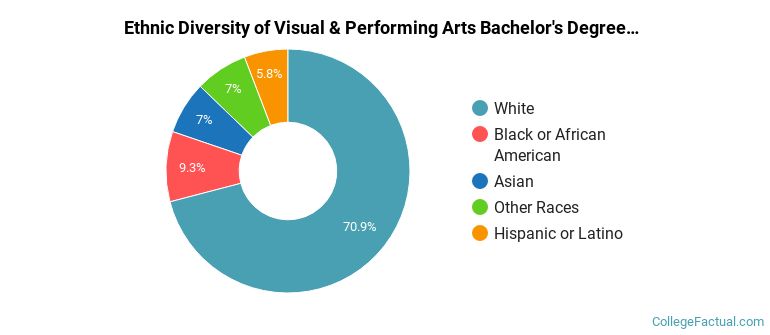
The majority of the students with this major are white. About 71% of 2022 graduates were in this category.
The following table and chart show the ethnic background for students who recently graduated from University of Louisville with a bachelor's in visual & performing arts.
| Ethnic Background | Number of Students |
|---|---|
| Asian | 6 |
| Black or African American | 8 |
| Hispanic or Latino | 5 |
| White | 61 |
| Non-Resident Aliens | 0 |
| Other Races | 6 |
UofL does not offer an online option for its visual & performing arts bachelor’s degree program at this time. To see if the school offers distance learning options in other areas, visit the UofL Online Learning page.
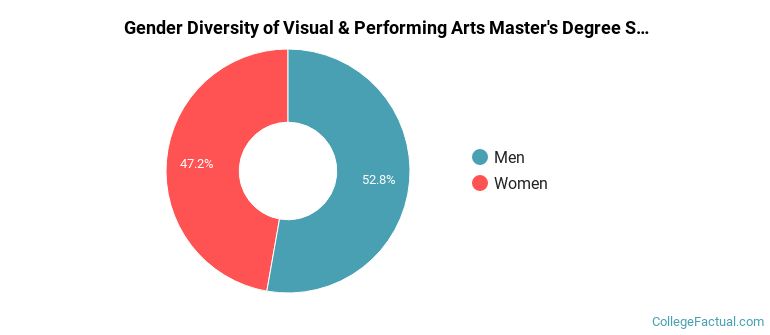
Of the 36 visual & performing arts students who graduated with a master's degree in 2021-2022 from UofL, about 53% were men and 47% were women.
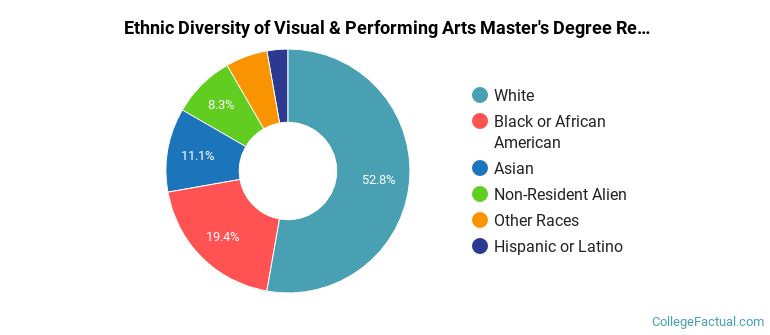
The majority of master's degree recipients in this major at UofL are white. In the most recent graduating class for which data is available, 53% of students fell into this category.
The following table and chart show the ethnic background for students who recently graduated from University of Louisville with a master's in visual & performing arts.
| Ethnic Background | Number of Students |
|---|---|
| Asian | 4 |
| Black or African American | 7 |
| Hispanic or Latino | 1 |
| White | 19 |
| Non-Resident Aliens | 3 |
| Other Races | 2 |
Take a look at the following statistics related to the make-up of the visual & performing arts majors at University of Louisville.
Visual & Performing Arts students may decide to major in one of the following focus areas. Individual majors may not be available for all degree levels.
| Major | Annual Graduates |
|---|---|
| Fine & Studio Arts | 66 |
| Music | 46 |
| Drama & Theater Arts | 10 |
| Other Visual Art | 6 |
More about our data sources and methodologies.