Here, you'll find out more about the major, including such details as the number of graduates, what degree levels are offered, ethnicity of students, and more. We've also included details on how UMA ranks compared to other colleges offering a major in dental support.
Jump to any of the following sections:
The bachelor's program at UMA was ranked #278 on College Factual's Best Schools for dental support list. It is also ranked #2 in Maine.
| Ranking Type | Rank |
|---|---|
| Best Dental Support Services Associate Degree Schools | 222 |
| Best Dental Support Services Schools | 278 |
During the 2021-2022 academic year, University of Maine at Augusta handed out 5 bachelor's degrees in dental support services. This is a decrease of 29% over the previous year when 7 degrees were handed out.
During the 2022-2023 academic year, part-time undergraduate students at UMA paid an average of $683 per credit hour if they came to the school from out-of-state. In-state students paid a discounted rate of $252 per credit hour. The average full-time tuition and fees for undergraduates are shown in the table below.
| In State | Out of State | |
|---|---|---|
| Tuition | $7,560 | $20,490 |
| Fees | $1,058 | $1,058 |
| Books and Supplies | $1,200 | $1,200 |
| On Campus Room and Board | $8,700 | $8,700 |
| On Campus Other Expenses | $3,600 | $3,600 |
Learn more about UMA tuition and fees.
In the 2021-2022 academic year, 5 students earned a bachelor's degree in dental support from UMA. About 80% of these graduates were women and the other 20% were men.

The following table and chart show the ethnic background for students who recently graduated from University of Maine at Augusta with a bachelor's in dental support.

| Ethnic Background | Number of Students |
|---|---|
| Asian | 0 |
| Black or African American | 0 |
| Hispanic or Latino | 0 |
| White | 2 |
| Non-Resident Aliens | 0 |
| Other Races | 3 |
Online degrees for the UMA dental support bachelor’s degree program are not available at this time. To see if the school offers distance learning options in other areas, visit the UMA Online Learning page.
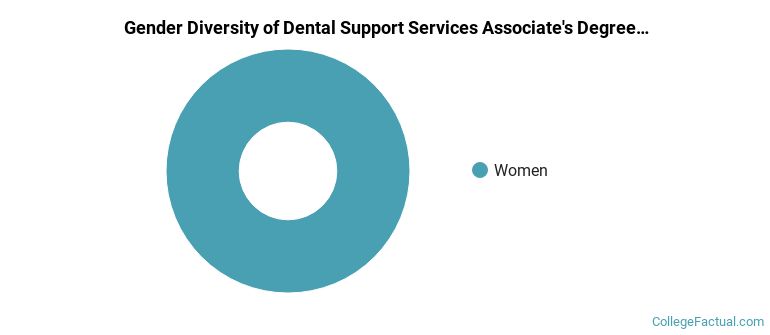
All of the 21 students who graduated with a Associate’s in dental support from UMA in 2022 were women.
The majority of the students with this major are white. About 71% of 2022 graduates were in this category.
The following table and chart show the ethnic background for students who recently graduated from University of Maine at Augusta with a associate's in dental support.
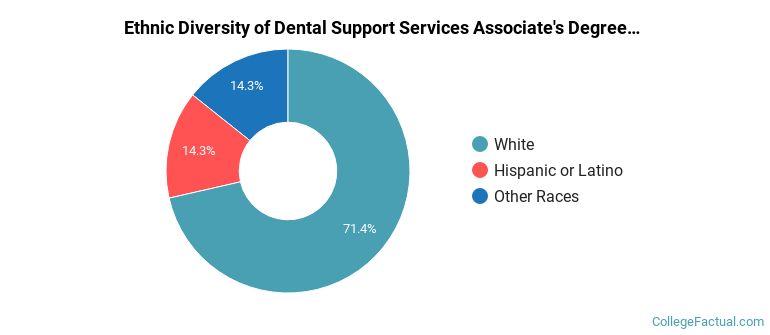
| Ethnic Background | Number of Students |
|---|---|
| Asian | 0 |
| Black or African American | 0 |
| Hispanic or Latino | 3 |
| White | 15 |
| Non-Resident Aliens | 0 |
| Other Races | 3 |
Take a look at the following statistics related to the make-up of the dental support majors at University of Maine at Augusta.
| Related Major | Annual Graduates |
|---|---|
| Mental & Social Health Services | 87 |
| Nursing | 60 |
| Allied Health & Medical Assisting Services | 5 |