Here, you'll find out more about the major, including such details as the number of graduates, what degree levels are offered, ethnicity of students, and more. Also, learn how UMCP ranks among other schools offering degrees in film.
Go directly to any of the following sections:
Learn about start dates, transferring credits, availability of financial aid, and more by contacting the universities below.
Take the first step toward a career of visual expression and doing what you love with this online associate degree from Southern New Hampshire University.
Learn to create a striking portfolio and hone the skills you need to succeed in the world of professional photography with this online digital photography degree from Southern New Hampshire University.
The bachelor's program at UMCP was ranked #79 on College Factual's Best Schools for film list. It is also ranked #3 in Maryland.
| Ranking Type | Rank |
|---|---|
| Best Film, Video & Photographic Arts Bachelor’s Degree Schools | 73 |
| Best Film, Video & Photographic Arts Schools | 79 |
During the 2021-2022 academic year, University of Maryland - College Park handed out 14 bachelor's degrees in film, video & photographic arts. This is a decrease of 18% over the previous year when 17 degrees were handed out.
In 2022-2023, the average part-time undergraduate tuition at UMCP was $1,613 per credit hour for out-of-state students. The average for in-state students was $412 per credit hour. The following table shows the average full-time tuition and fees for undergraduates.
| In State | Out of State | |
|---|---|---|
| Tuition | $9,889 | $38,690 |
| Fees | $1,616 | $1,616 |
| Books and Supplies | $1,250 | $1,250 |
| On Campus Room and Board | $15,416 | $15,416 |
| On Campus Other Expenses | $2,714 | $2,714 |
Learn more about UMCP tuition and fees.
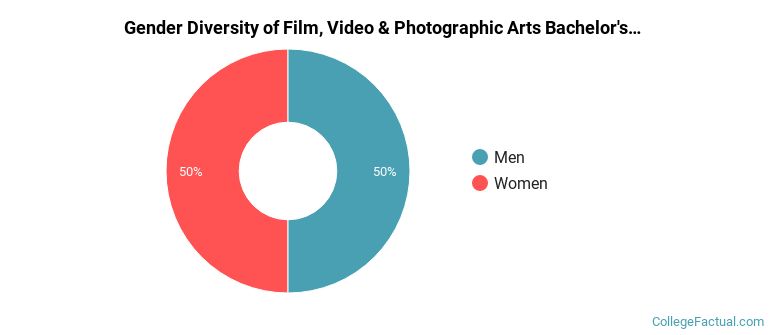
In the 2021-2022 academic year, 14 students earned a bachelor's degree in film from UMCP. About 50% of these graduates were women and the other 50% were men.
The following table and chart show the ethnic background for students who recently graduated from University of Maryland - College Park with a bachelor's in film.
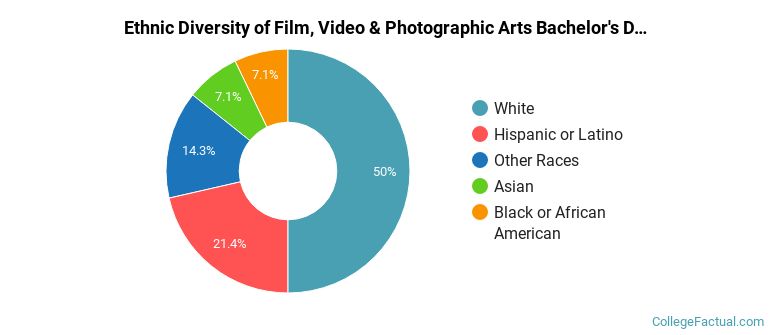
| Ethnic Background | Number of Students |
|---|---|
| Asian | 1 |
| Black or African American | 1 |
| Hispanic or Latino | 3 |
| White | 7 |
| Non-Resident Aliens | 0 |
| Other Races | 2 |
Online degrees for the UMCP film bachelor’s degree program are not available at this time. To see if the school offers distance learning options in other areas, visit the UMCP Online Learning page.
Take a look at the following statistics related to the make-up of the film majors at University of Maryland - College Park.
| Related Major | Annual Graduates |
|---|---|
| Fine & Studio Arts | 103 |
| Music | 99 |
| Drama & Theater Arts | 51 |
| Dance | 14 |
More about our data sources and methodologies.
