We've pulled together some essential information you should know about the program, including how many students graduate each year, the ethnic diversity of these students, average starting salaries, and more. We've also included details on how UMass Amherst ranks compared to other colleges offering a major in sociology.
Go directly to any of the following sections:
UMass Amherst is in the top 10% of the country for sociology. More specifically it was ranked #26 out of 483 schools by College Factual. It is also ranked #3 in Massachusetts.
| Ranking Type | Rank |
|---|---|
| Best Sociology Schools | 26 |
| Best Sociology Bachelor’s Degree Schools | 26 |
During the 2021-2022 academic year, University of Massachusetts Amherst handed out 121 bachelor's degrees in sociology. This is a decrease of 4% over the previous year when 126 degrees were handed out.
In 2022, 5 students received their master’s degree in sociology from UMass Amherst. This makes it the #94 most popular school for sociology master’s degree candidates in the country.
In addition, 6 students received their doctoral degrees in sociology in 2022, making the school the #31 most popular school in the United States for this category of students.
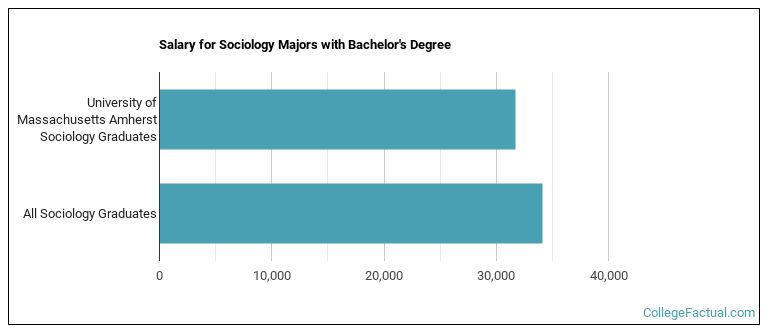
The median salary of sociology students who receive their bachelor's degree at UMass Amherst is $31,686. Unfortunately, this is lower than the national average of $34,105 for all sociology students.
During the 2022-2023 academic year, part-time undergraduate students at UMass Amherst paid an average of $1,605 per credit hour if they came to the school from out-of-state. In-state students paid a discounted rate of $691 per credit hour. Information about average full-time undergraduate tuition and fees is shown in the table below.
| In State | Out of State | |
|---|---|---|
| Tuition | $16,591 | $38,527 |
| Fees | $766 | $766 |
| Books and Supplies | $1,000 | $1,000 |
| On Campus Room and Board | $14,869 | $14,869 |
| On Campus Other Expenses | $1,440 | $1,440 |
Learn more about UMass Amherst tuition and fees.
Of the 121 students who graduated with a Bachelor’s in sociology from UMass Amherst in 2022, 26% were men and 74% were women.

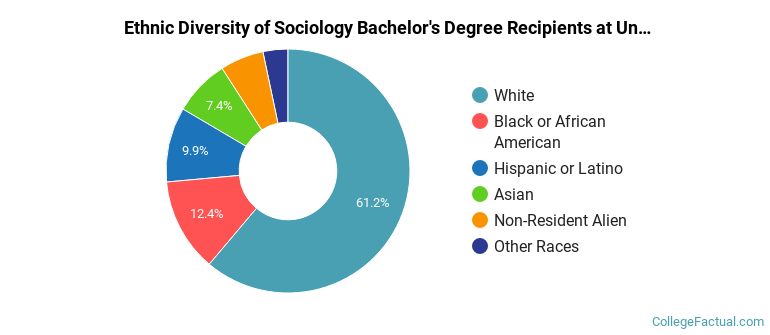
The majority of the students with this major are white. About 61% of 2022 graduates were in this category.
The following table and chart show the ethnic background for students who recently graduated from University of Massachusetts Amherst with a bachelor's in sociology.
| Ethnic Background | Number of Students |
|---|---|
| Asian | 9 |
| Black or African American | 15 |
| Hispanic or Latino | 12 |
| White | 74 |
| Non-Resident Aliens | 7 |
| Other Races | 4 |
Online degrees for the UMass Amherst sociology bachelor’s degree program are not available at this time. To see if the school offers distance learning options in other areas, visit the UMass Amherst Online Learning page.
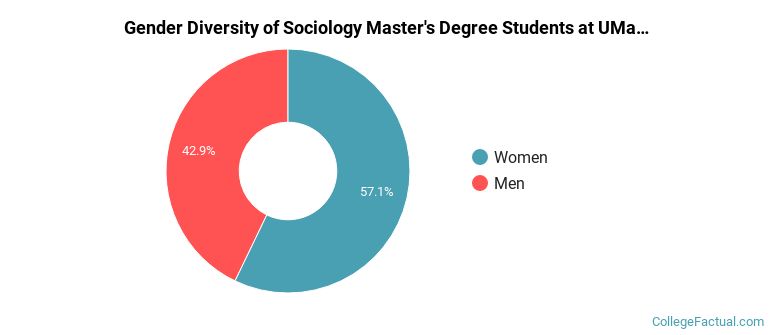
In the 2021-2022 academic year, 7 students earned a master's degree in sociology from UMass Amherst. About 57% of these graduates were women and the other 43% were men.
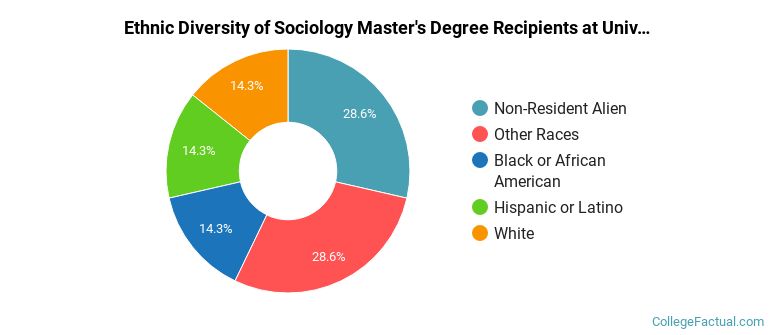
The following table and chart show the ethnic background for students who recently graduated from University of Massachusetts Amherst with a master's in sociology.
| Ethnic Background | Number of Students |
|---|---|
| Asian | 0 |
| Black or African American | 1 |
| Hispanic or Latino | 1 |
| White | 1 |
| Non-Resident Aliens | 2 |
| Other Races | 2 |
Take a look at the following statistics related to the make-up of the sociology majors at University of Massachusetts Amherst.
| Related Major | Annual Graduates |
|---|---|
| Economics | 384 |
| Political Science & Government | 195 |
| Anthropology | 43 |
| Geography & Cartography | 43 |
| International Relations & National Security | 21 |
More about our data sources and methodologies.