We've gathered data and other essential information about the program, such as the ethnicity of students, how many students graduated in recent times, and more. In addition, we cover how U-M ranks in comparison to other schools with health & medical administrative services programs.
Jump to any of the following sections:
Ranked at #6 in College Factual's most recent rankings, U-M is in the top 1% of the country for health & medical administrative services students pursuing a bachelor's degree.
In 2022, 72 students received their master’s degree in health & medical administrative services from U-M. This makes it the #46 most popular school for health & medical administrative services master’s degree candidates in the country.
In 2022-2023, the average part-time undergraduate tuition at U-M was $2,458 per credit hour for out-of-state students. The average for in-state students was $716 per credit hour. The average full-time tuition and fees for undergraduates are shown in the table below.
| In State | Out of State | |
|---|---|---|
| Tuition | $17,977 | $59,775 |
| Fees | $332 | $332 |
| Books and Supplies | $1,126 | $1,126 |
| On Campus Room and Board | $13,856 | $13,856 |
| On Campus Other Expenses | $2,572 | $2,572 |
Learn more about U-M tuition and fees.
U-M does not offer an online option for its health & medical administrative services bachelor’s degree program at this time. To see if the school offers distance learning options in other areas, visit the U-M Online Learning page.
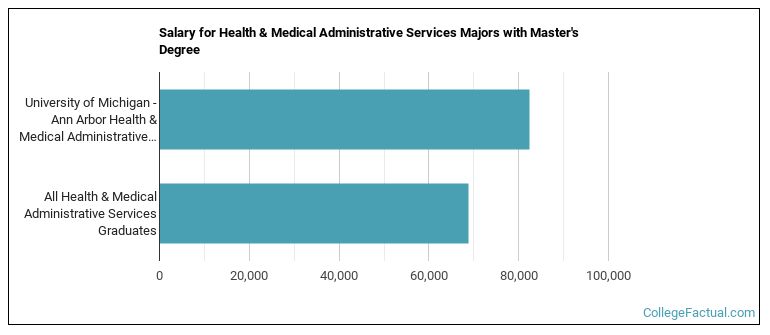
Health & Medical Administrative Services majors graduating with a master's degree from U-M make a median salary of $82,371 a year. This is a better than average outcome since the median salary for all health & medical administrative services graduates with a master's is $68,719.
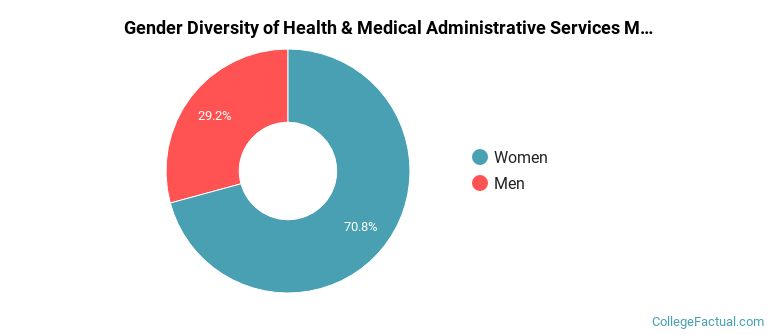
The health & medical administrative services program at U-M awarded 65 master's degrees in 2021-2022. About 29% of these degrees went to men with the other 71% going to women.
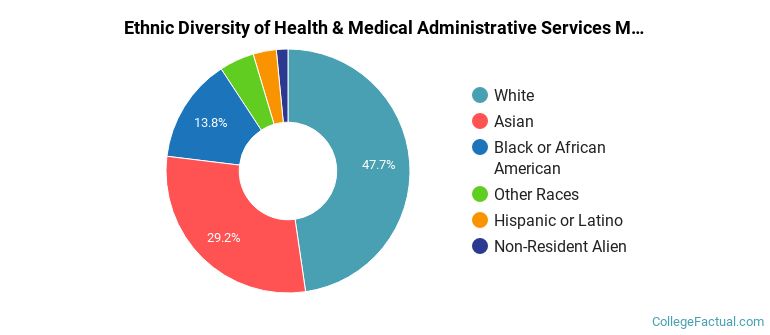
The following table and chart show the ethnic background for students who recently graduated from University of Michigan - Ann Arbor with a master's in health & medical administrative services.
| Ethnic Background | Number of Students |
|---|---|
| Asian | 19 |
| Black or African American | 9 |
| Hispanic or Latino | 2 |
| White | 31 |
| Non-Resident Aliens | 1 |
| Other Races | 3 |
Take a look at the following statistics related to the make-up of the health & medical administrative services majors at University of Michigan - Ann Arbor.
| Related Major | Annual Graduates |
|---|---|
| Nursing | 331 |
| Public Health | 285 |
| Medicine | 162 |
| Pharmacy/Pharmaceutical Sciences | 135 |
| Dentistry | 123 |
View All Health & Medical Administrative Services Related Majors >
More about our data sources and methodologies.