Here, you'll find out more about the major, including such details as the number of graduates, what degree levels are offered, ethnicity of students, average salaries, and more. In addition, we cover how University of New Haven ranks in comparison to other schools with dental support programs.
Go directly to any of the following sections:
The bachelor's program at University of New Haven was ranked #63 on College Factual's Best Schools for dental support list. It is also ranked #1 in Connecticut.
| Ranking Type | Rank |
|---|---|
| Best Dental Support Services Associate Degree Schools | 31 |
| Best Dental Support Services Bachelor’s Degree Schools | 33 |
| Best Dental Support Services Schools | 63 |
During the 2021-2022 academic year, University of New Haven handed out 27 bachelor's degrees in dental support services. This is a decrease of 7% over the previous year when 29 degrees were handed out.
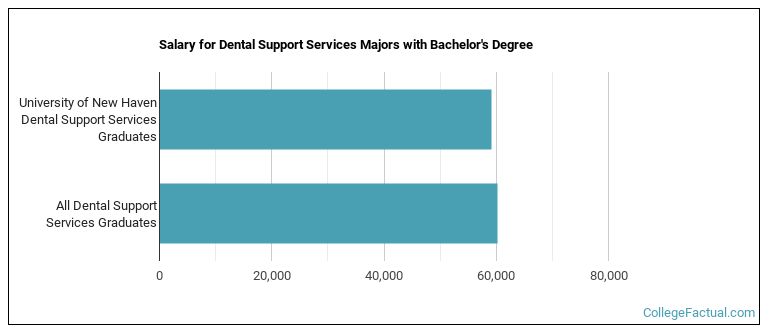
The median salary of dental support students who receive their bachelor's degree at University of New Haven is $59,086. This is less than $60,171, which is the national median of all dental support majors in the nation who earn bachelor's degrees.
During the 2022-2023 academic year, part-time undergraduate students at University of New Haven paid an average of $1,470 per credit hour. No discount was available for in-state students. Information about average full-time undergraduate tuition and fees is shown in the table below.
| In State | Out of State | |
|---|---|---|
| Tuition | $44,100 | $44,100 |
| Fees | $1,630 | $1,630 |
| Books and Supplies | $1,240 | $1,240 |
| On Campus Room and Board | $19,954 | $19,954 |
| On Campus Other Expenses | $2,680 | $2,680 |
Learn more about University of New Haven tuition and fees.
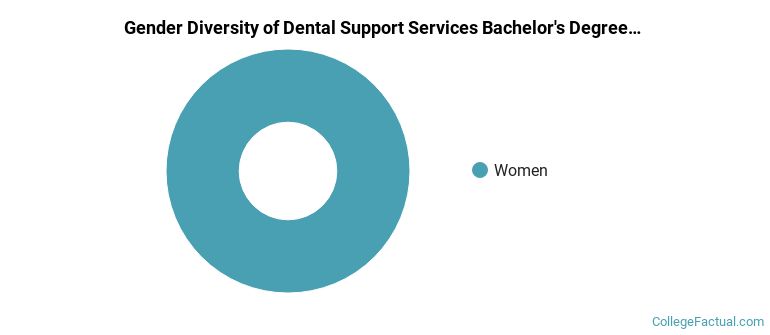
All of the 27 students who graduated with a Bachelor’s in dental support from University of New Haven in 2022 were women.
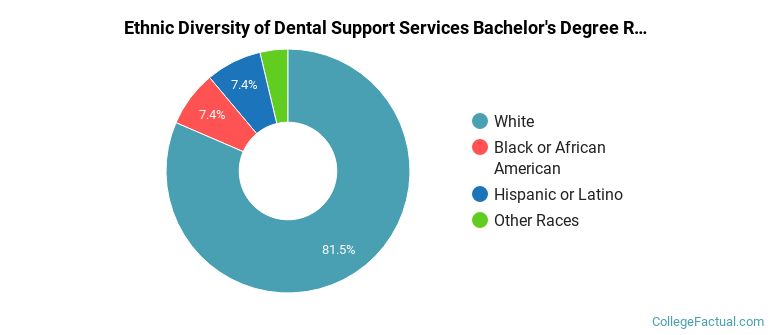
The majority of the students with this major are white. About 81% of 2022 graduates were in this category.
The following table and chart show the ethnic background for students who recently graduated from University of New Haven with a bachelor's in dental support.
| Ethnic Background | Number of Students |
|---|---|
| Asian | 0 |
| Black or African American | 2 |
| Hispanic or Latino | 2 |
| White | 22 |
| Non-Resident Aliens | 0 |
| Other Races | 1 |
University of New Haven does not offer an online option for its dental support bachelor’s degree program at this time. To see if the school offers distance learning options in other areas, visit the University of New Haven Online Learning page.
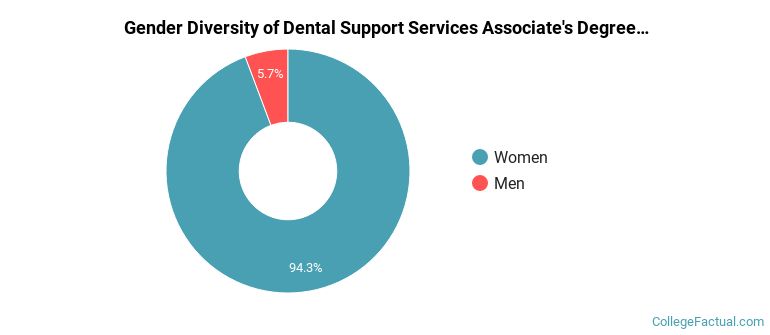
During the 2021-2022 academic year, 35 dental support majors earned their associate's degree from University of New Haven. Of these graduates, 6% were men and 94% were women.
The majority of the students with this major are white. About 83% of 2022 graduates were in this category.
The following table and chart show the ethnic background for students who recently graduated from University of New Haven with a associate's in dental support.
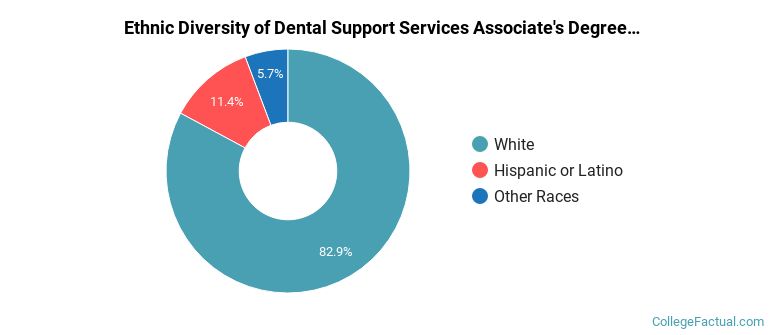
| Ethnic Background | Number of Students |
|---|---|
| Asian | 0 |
| Black or African American | 0 |
| Hispanic or Latino | 4 |
| White | 29 |
| Non-Resident Aliens | 0 |
| Other Races | 2 |
Take a look at the following statistics related to the make-up of the dental support majors at University of New Haven.
| Related Major | Annual Graduates |
|---|---|
| Health & Medical Administrative Services | 63 |
| Public Health | 30 |
| Health Sciences & Services | 28 |
| Allied Health Professions | 23 |
| Dietetics & Clinical Nutrition Services | 15 |
More about our data sources and methodologies.