Jump to any of the following sections:
The bachelor's program at UNCW was ranked #238 on College Factual's Best Schools for social sciences list. It is also ranked #7 in North Carolina.
| Ranking Type | Rank |
|---|---|
| Best Social Sciences Bachelor’s Degree Schools | 233 |
| Best Social Sciences Schools | 238 |
During the 2021-2022 academic year, University of North Carolina at Wilmington handed out 217 bachelor's degrees in social sciences. This is a decrease of 8% over the previous year when 236 degrees were handed out.
In 2022-2023, the average part-time undergraduate tuition at UNCW was $838 per credit hour for out-of-state students. The average for in-state students was $185 per credit hour. The following table shows the average full-time tuition and fees for undergraduates.
| In State | Out of State | |
|---|---|---|
| Tuition | $4,443 | $20,111 |
| Fees | $2,874 | $2,874 |
| Books and Supplies | $1,130 | $1,130 |
| On Campus Room and Board | $12,605 | $12,605 |
| On Campus Other Expenses | $5,978 | $5,978 |
Learn more about UNCW tuition and fees.
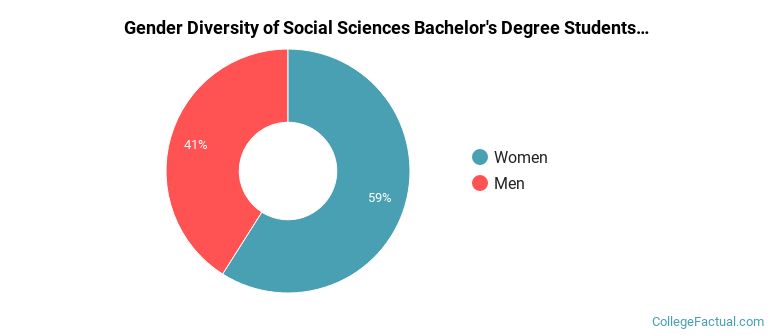
For the most recent academic year available, 41% of social sciences bachelor's degrees went to men and 59% went to women.
The majority of bachelor's degree recipients in this major at UNCW are white. In the most recent graduating class for which data is available, 81% of students fell into this category.
The following table and chart show the ethnic background for students who recently graduated from University of North Carolina at Wilmington with a bachelor's in social sciences.

| Ethnic Background | Number of Students |
|---|---|
| Asian | 2 |
| Black or African American | 9 |
| Hispanic or Latino | 15 |
| White | 175 |
| Non-Resident Aliens | 1 |
| Other Races | 15 |
If you’re one of the many students who want the flexibility of distance learning courses, you’ll be happy to hear that UNCW offers online option in its social sciences bachelor’s degree program. To see if the school offers distance learning options in other areas, visit the UNCW Online Learning page.
Of the 6 students who graduated with a Master’s in social sciences from UNCW in 2022, 17% were men and 83% were women.

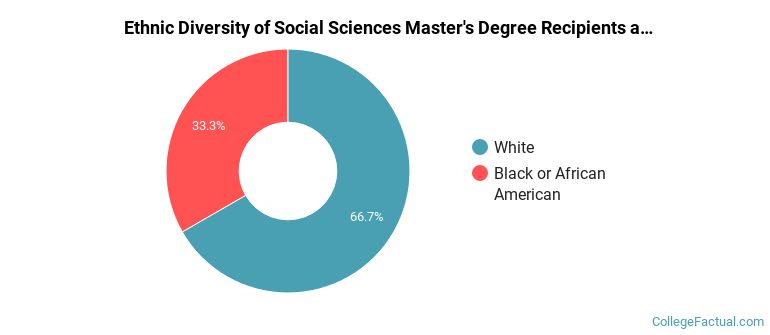
The majority of master's degree recipients in this major at UNCW are white. In the most recent graduating class for which data is available, 67% of students fell into this category.
The following table and chart show the ethnic background for students who recently graduated from University of North Carolina at Wilmington with a master's in social sciences.
| Ethnic Background | Number of Students |
|---|---|
| Asian | 0 |
| Black or African American | 2 |
| Hispanic or Latino | 0 |
| White | 4 |
| Non-Resident Aliens | 0 |
| Other Races | 0 |
Take a look at the following statistics related to the make-up of the social sciences majors at University of North Carolina at Wilmington.
Social Sciences students may decide to major in one of the following focus areas. Individual majors may not be available for all degree levels.
| Major | Annual Graduates |
|---|---|
| Political Science & Government | 51 |
| Anthropology | 27 |
| Sociology | 23 |
| Economics | 16 |
| Geography & Cartography | 16 |
| Related Major | Annual Graduates |
|---|---|
| Communication & Journalism | 261 |
| English Language & Literature | 121 |
| History | 80 |
| Foreign Languages & Linguistics | 46 |
| Philosophy & Religious Studies | 19 |