We’ve pulled together the essential facts you should know about the program at University of South Carolina-Columbia. You can study it at the Bachelor’s level. It ranks as high as #1 out of 1 schools (Bachelor’s level) by College Factual. Jump to any of the following sections:
College Factual ranks University of South Carolina-Columbia as a strong choice for dance, placing at #36 out of 96 schools nationally.
| Ranking | Rank |
|---|---|
| Best Dance Schools | 36 of 96 |
| Best Dance Schools in South Carolina | 1 of 1 |
| Best Dance Schools in the Southeast Region | 5 of 22 |
The table below lists every degree level offered in dance at University of South Carolina-Columbia, along with how many graduates complete each level annually.
| Degree Level | Annual Graduates |
|---|---|
| Bachelor’s | 13 |
In the most recent year for which we have data, University of South Carolina-Columbia awarded 13 bachelor’s degrees in dance.
University of South Carolina-Columbia is among the very best schools in the country for dance at the bachelor’s level. Specifically, it ranked #1 out of 1 schools by College Factual.
| Ranking | Rank |
|---|---|
| Best Dance Bachelor’s Degree Schools in South Carolina | 1 |
| Best Dance Bachelor’s Degree Schools in the Southeast Region | 5 |
| Best Dance Bachelor’s Degree Schools | 35 |
Information about average full-time undergraduate tuition and fees is shown in the table below.
| In State | Out of State | |
|---|---|---|
| Tuition | $12,288 | $35,898 |
| Fees | $400 | $400 |
Learn more about University of South Carolina-Columbia tuition and fees.
Every one of the 13 students who graduated with a bachelor’s degree in dance from University of South Carolina-Columbia were women.
 The largest share of dance bachelor’s degree graduates at University of South Carolina-Columbia are White. About 85% of graduates fell into this category.
The following table and chart show the ethnic background for students who recently graduated from University of South Carolina-Columbia with a bachelor’s in dance.
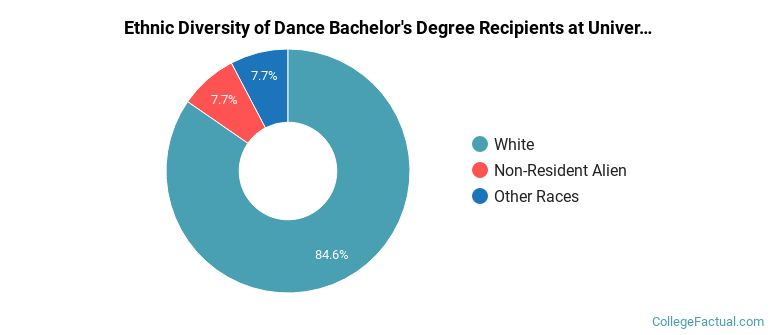
| Ethnic Background | Number of Students |
|---|---|
| Asian | 0 |
| Black or African American | 0 |
| Hispanic or Latino | 0 |
| White | 11 |
| Non-Resident Aliens | 1 |
| Other Races | 1 |