We've pulled together some essential information you should know about the program, including how many students graduate each year, the ethnic diversity of these students, average starting salaries, and more. In addition, we cover how UIW ranks in comparison to other schools with business administration programs.
Go directly to any of the following sections:
The bachelor's program at UIW was ranked #413 on College Factual's Best Schools for business administration list. It is also ranked #19 in Texas.
During the 2021-2022 academic year, University of the Incarnate Word handed out 152 bachelor's degrees in business administration & management. This is a decrease of 22% over the previous year when 195 degrees were handed out.
In 2022, 334 students received their master’s degree in business administration from UIW. This makes it the #63 most popular school for business administration master’s degree candidates in the country.
In addition, 10 students received their doctoral degrees in business administration in 2022, making the school the #58 most popular school in the United States for this category of students.
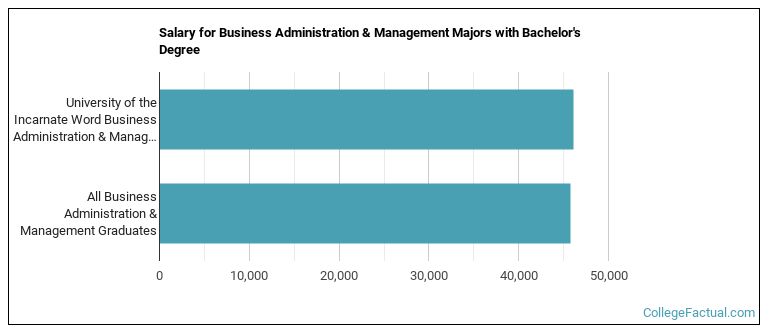
The median salary of business administration students who receive their bachelor's degree at UIW is $46,092. This is great news for graduates of the program, since this figure is higher than the national average of $45,741 for all business administration bachelor's degree recipients.
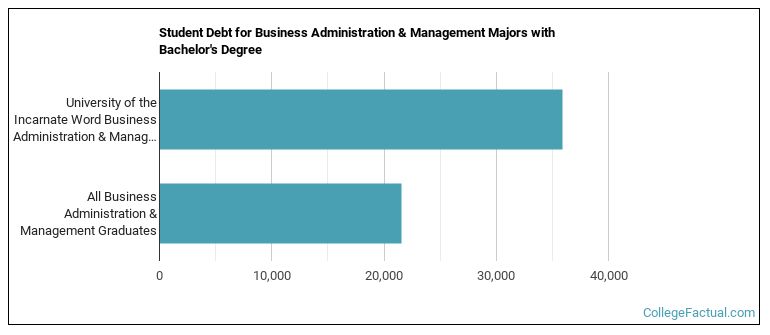
While getting their bachelor's degree at UIW, business administration students borrow a median amount of $35,897 in student loans. This is higher than the the typical median of $21,553 for all business administration majors across the country.
The typical student loan payment of a bachelor's degree student from the business administration program at UIW is $382 per month.
In 2022-2023, the average part-time undergraduate tuition at UIW was $1,050 per credit hour for both in-state and out-of-state students. The following table shows the average full-time tuition and fees for undergraduates.
| In State | Out of State | |
|---|---|---|
| Tuition | $33,700 | $33,700 |
| Fees | $1,960 | $1,960 |
| Books and Supplies | $250 | $250 |
| On Campus Room and Board | $13,746 | $13,746 |
| On Campus Other Expenses | $4,314 | $4,314 |
Learn more about UIW tuition and fees.
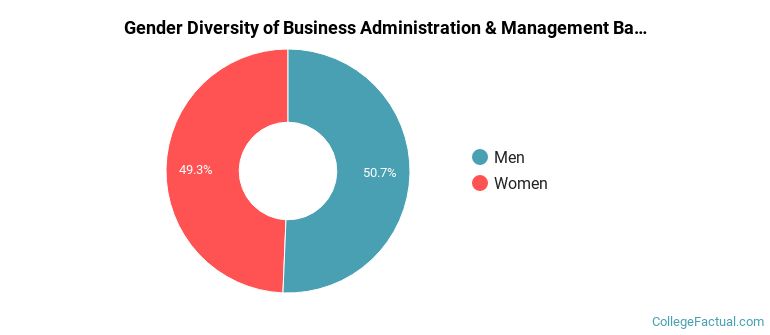
The business administration program at UIW awarded 152 bachelor's degrees in 2021-2022. About 51% of these degrees went to men with the other 49% going to women.
The majority of the bachelor's degree graduates for this major are Hispanic or Latino. In the most recent graduating class for which data is available, 54% of grads fell into this category.
The following table and chart show the ethnic background for students who recently graduated from University of the Incarnate Word with a bachelor's in business administration.
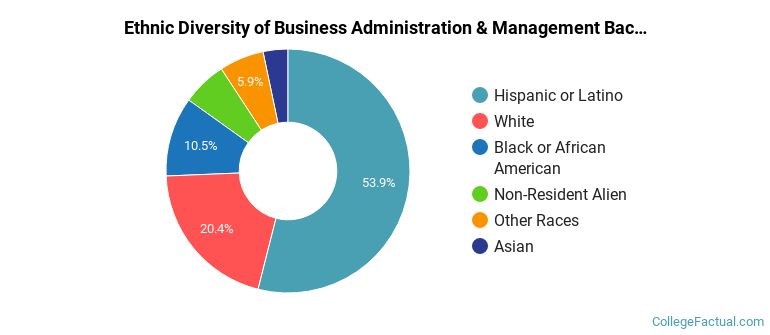
| Ethnic Background | Number of Students |
|---|---|
| Asian | 5 |
| Black or African American | 16 |
| Hispanic or Latino | 82 |
| White | 31 |
| Non-Resident Aliens | 9 |
| Other Races | 9 |
UIW does not offer an online option for its business administration bachelor’s degree program at this time. To see if the school offers distance learning options in other areas, visit the UIW Online Learning page.
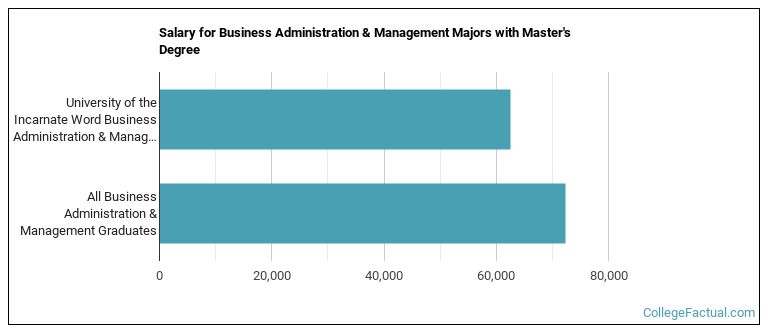
Business Administration majors graduating with a master's degree from UIW make a median salary of $62,507 a year. This is less than what their typical peers from other schools make. Their median salary is $72,329.
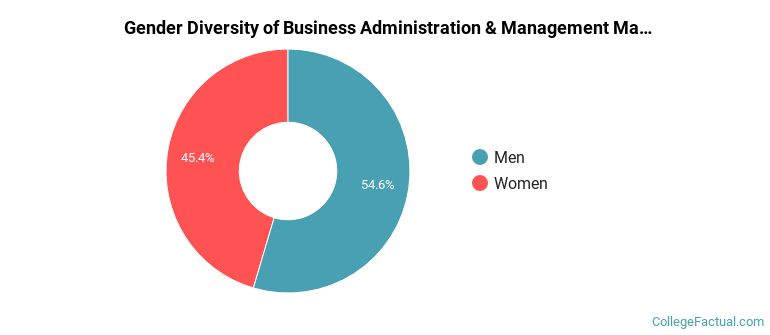
Of the 262 students who graduated with a Master’s in business administration from UIW in 2022, 55% were men and 45% were women.
The following table and chart show the ethnic background for students who recently graduated from University of the Incarnate Word with a master's in business administration.
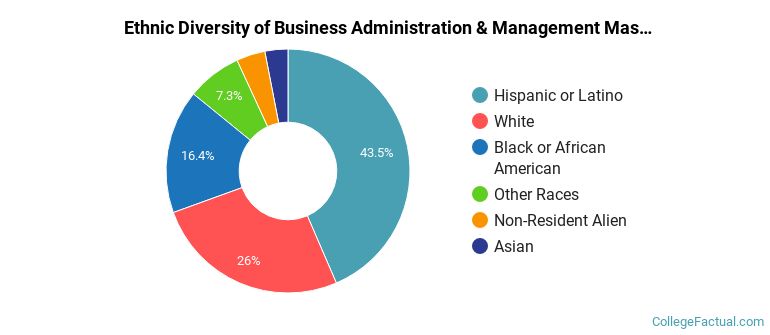
| Ethnic Background | Number of Students |
|---|---|
| Asian | 8 |
| Black or African American | 43 |
| Hispanic or Latino | 114 |
| White | 68 |
| Non-Resident Aliens | 10 |
| Other Races | 19 |
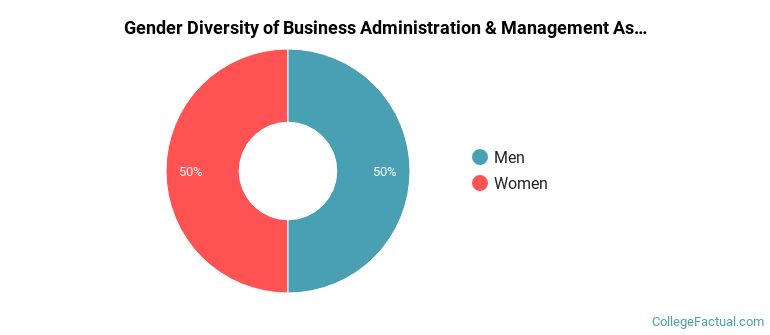
The business administration program at UIW awarded 6 associate's degrees in 2021-2022. About 50% of these degrees went to men with the other 50% going to women.
The following table and chart show the ethnic background for students who recently graduated from University of the Incarnate Word with a associate's in business administration.
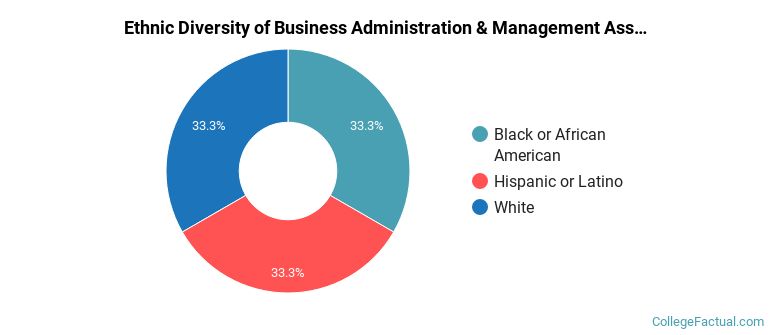
| Ethnic Background | Number of Students |
|---|---|
| Asian | 0 |
| Black or African American | 2 |
| Hispanic or Latino | 2 |
| White | 2 |
| Non-Resident Aliens | 0 |
| Other Races | 0 |
Take a look at the following statistics related to the make-up of the business administration majors at University of the Incarnate Word.
| Related Major | Annual Graduates |
|---|---|
| Human Resource Management | 219 |
| Accounting | 51 |
| Finance & Financial Management | 21 |
| Management Information Systems | 21 |
| Marketing | 21 |
View All Business Administration & Management Related Majors >