We've gathered data and other essential information about the program, such as the average salary of graduates, ethnicity of students, how many students graduated in recent times, and more. We've also included details on how U of U ranks compared to other colleges offering a major in ce.
Jump to any of the following sections:
The bachelor's program at U of U was ranked #88 on College Factual's Best Schools for ce list. It is also ranked #2 in Utah.
During the 2021-2022 academic year, University of Utah handed out 28 bachelor's degrees in computer engineering. This is a decrease of 7% over the previous year when 30 degrees were handed out.
In 2022, 32 students received their master’s degree in ce from U of U. This makes it the #39 most popular school for ce master’s degree candidates in the country.
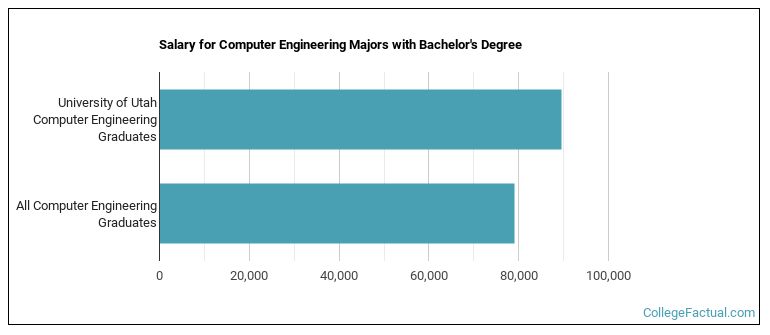
CE majors who earn their bachelor's degree from U of U go on to jobs where they make a median salary of $89,605 a year. This is great news for graduates of the program, since this figure is higher than the national average of $78,964 for all ce bachelor's degree recipients.
During the 2022-2023 academic year, part-time undergraduate students at U of U paid an average of $890 per credit hour if they came to the school from out-of-state. In-state students paid a discounted rate of $259 per credit hour. The following table shows the average full-time tuition and fees for undergraduates.
| In State | Out of State | |
|---|---|---|
| Tuition | $8,175 | $28,697 |
| Fees | $1,140 | $1,140 |
| Books and Supplies | $1,100 | $1,100 |
| On Campus Room and Board | $12,398 | $12,398 |
| On Campus Other Expenses | $7,800 | $7,800 |
Learn more about U of U tuition and fees.
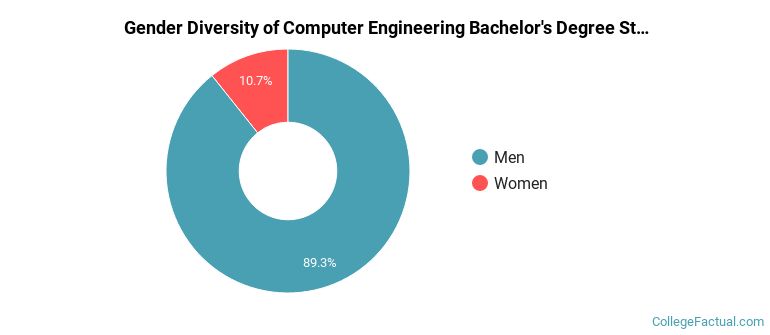
Of the 28 students who earned a bachelor's degree in Computer Engineering from U of U in 2021-2022, 89% were men and 11% were women.
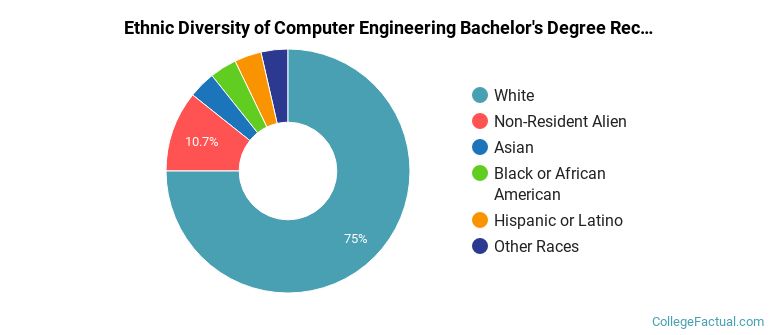
The majority of bachelor's degree recipients in this major at U of U are white. In the most recent graduating class for which data is available, 75% of students fell into this category.
The following table and chart show the ethnic background for students who recently graduated from University of Utah with a bachelor's in ce.
| Ethnic Background | Number of Students |
|---|---|
| Asian | 1 |
| Black or African American | 1 |
| Hispanic or Latino | 1 |
| White | 21 |
| Non-Resident Aliens | 3 |
| Other Races | 1 |
Online degrees for the U of U ce bachelor’s degree program are not available at this time. To see if the school offers distance learning options in other areas, visit the U of U Online Learning page.
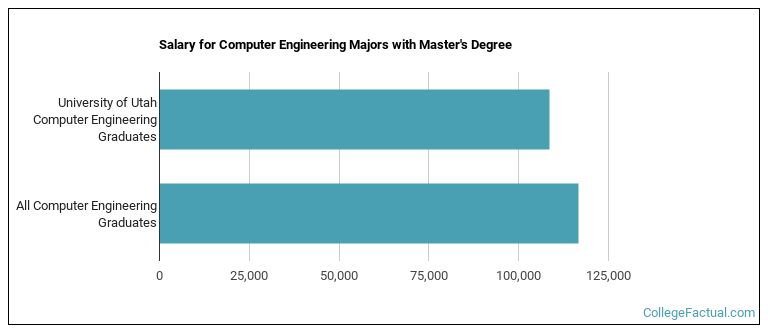
CE majors graduating with a master's degree from U of U make a median salary of $108,534 a year. This is less than what their typical peers from other schools make. Their median salary is $116,528.
During the 2021-2022 academic year, 28 students graduated with a master's degree in ce from U of U. About 79% were men and 21% were women.
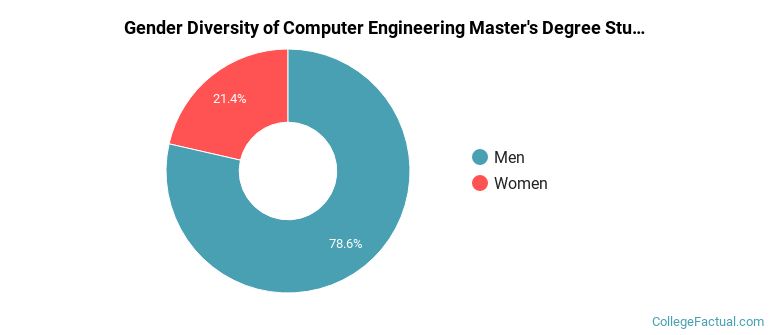
The majority of master's degree recipients in this major at U of U are white. In the most recent graduating class for which data is available, 79% of students fell into this category.
The following table and chart show the ethnic background for students who recently graduated from University of Utah with a master's in ce.
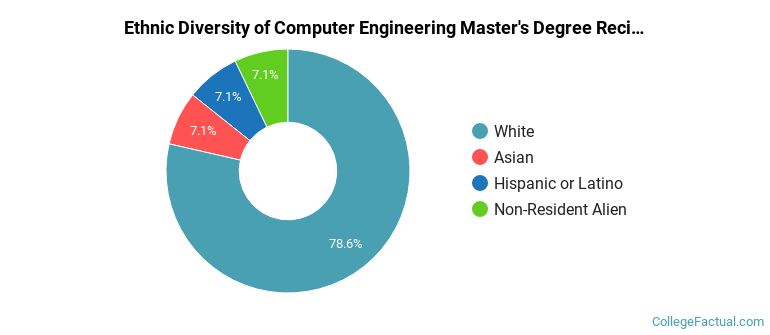
| Ethnic Background | Number of Students |
|---|---|
| Asian | 2 |
| Black or African American | 0 |
| Hispanic or Latino | 2 |
| White | 22 |
| Non-Resident Aliens | 2 |
| Other Races | 0 |
Take a look at the following statistics related to the make-up of the ce majors at University of Utah.
| Related Major | Annual Graduates |
|---|---|
| Mechanical Engineering | 282 |
| Biomedical Engineering | 139 |
| Electrical Engineering | 107 |
| Civil Engineering | 89 |
| Chemical Engineering | 86 |
More about our data sources and methodologies.