We’ve pulled together the essential facts you should know about the program at UW-Seattle, UDub, UW, Washington. Degrees are awarded at the Bachelor’s level, with graduate study also available. At its best it places at #2 out of 6 schools (Bachelor’s level) by College Factual. Jump to any of the following sections:
College Factual ranks UW-Seattle, UDub, UW, Washington highly for teacher education subject specific, placing at #6 out of 554 schools nationally.
| Ranking | Rank |
|---|---|
| Best Teacher Education Subject Specific Schools | 6 of 554 |
| Best Teacher Education Subject Specific Schools in Washington | 1 of 7 |
The table below lists every degree level granted in teacher education subject specific at UW-Seattle, UDub, UW, Washington, along with how many graduates complete each level annually.
| Degree Level | Annual Graduates |
|---|---|
| Bachelor’s | 21 |
| Master’s | 58 |
| Doctoral | 3 |
For the most recent IPEDS reporting year, University of Washington-Seattle Campus awarded 21 bachelor’s degrees in teacher education subject specific.
UW-Seattle, UDub, UW, Washington ranks competitively among schools offering teacher education subject specific at the bachelor’s level. Its best result was #2 out of 6 schools by College Factual.
Teacher Education Subject Specific majors who earn their bachelor’s degree from UW-Seattle, UDub, UW, Washington go on to jobs where they make a median salary of $72,291 a year. This is below $90,738, the median for all majors at UW-Seattle, UDub, UW, Washington.

Average full-time tuition and fees are listed in the table below.
| In State | Out of State | |
|---|---|---|
| Tuition | $10,927 | $42,105 |
| Fees | $1,104 | $1,104 |
Learn more about UW-Seattle, UDub, UW, Washington tuition and fees.
For the most recent academic year available, 43% of teacher education subject specific bachelor’s degrees went to men and 57% went to women.
 The largest share of teacher education subject specific bachelor’s degree graduates at UW-Seattle, UDub, UW, Washington are White. Roughly 57% of graduates fell into this category.
The following table and chart show the ethnic background for students who recently graduated from University of Washington-Seattle Campus with a bachelor’s in teacher education subject specific.
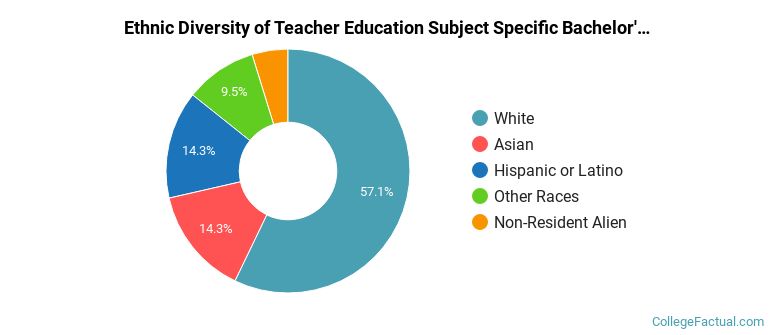
| Ethnic Background | Number of Students |
|---|---|
| Asian | 3 |
| Black or African American | 0 |
| Hispanic or Latino | 3 |
| White | 12 |
| Non-Resident Aliens | 1 |
| Other Races | 2 |
UW-Seattle, UDub, UW, Washington awarded 12 bachelor’s completions in music teacher education in the latest year of data — 50% to women and 50% to men. The most common background among these graduates was White (58%).
UW-Seattle, UDub, UW, Washington conferred 9 bachelor’s degrees in mathematics teacher education in the most recent reporting year — 67% to women and 33% to men. The most common background among these graduates was White (56%).
Graduate study is also available at UW-Seattle, UDub, UW, Washington. Annual graduate completions by level are shown below.
| Graduate Level | Annual Graduates |
|---|---|
| Master’s Degrees in Teacher Education Subject Specific | 58 |
| Doctoral Degrees in Teacher Education Subject Specific | 3 |