Jump to any of the following sections:
The bachelor's program at UW - Whitewater was ranked #310 on College Factual's Best Schools for education list. It is also ranked #7 in Wisconsin.
During the 2021-2022 academic year, University of Wisconsin - Whitewater handed out 314 bachelor's degrees in education. This is a decrease of 48% over the previous year when 600 degrees were handed out.
In 2022, 179 students received their master’s degree in education from UW - Whitewater. This makes it the #240 most popular school for education master’s degree candidates in the country.
In 2022-2023, the average part-time undergraduate tuition at UW - Whitewater was $687 per credit hour for out-of-state students. The average for in-state students was $284 per credit hour. The average full-time tuition and fees for undergraduates are shown in the table below.
| In State | Out of State | |
|---|---|---|
| Tuition | $6,812 | $16,478 |
| Fees | $1,438 | $1,438 |
| Books and Supplies | $300 | $300 |
| On Campus Room and Board | $7,770 | $7,770 |
| On Campus Other Expenses | $3,240 | $3,240 |
Learn more about UW - Whitewater tuition and fees.
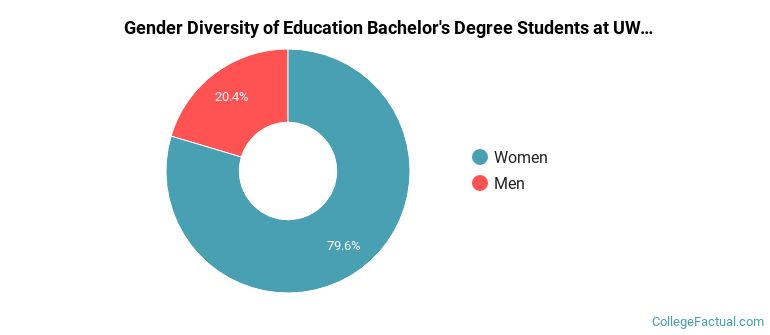
During the 2021-2022 academic year, 314 students graduated with a bachelor's degree in education from UW - Whitewater. About 20% were men and 80% were women.
The majority of bachelor's degree recipients in this major at UW - Whitewater are white. In the most recent graduating class for which data is available, 87% of students fell into this category.
The following table and chart show the ethnic background for students who recently graduated from University of Wisconsin - Whitewater with a bachelor's in education.

| Ethnic Background | Number of Students |
|---|---|
| Asian | 2 |
| Black or African American | 9 |
| Hispanic or Latino | 23 |
| White | 272 |
| Non-Resident Aliens | 0 |
| Other Races | 8 |
Looking for online learning options? Good news, you can take online classes in the education bachelor’s degree program at UW - Whitewater. To see if the school offers distance learning options in other areas, visit the UW - Whitewater Online Learning page.
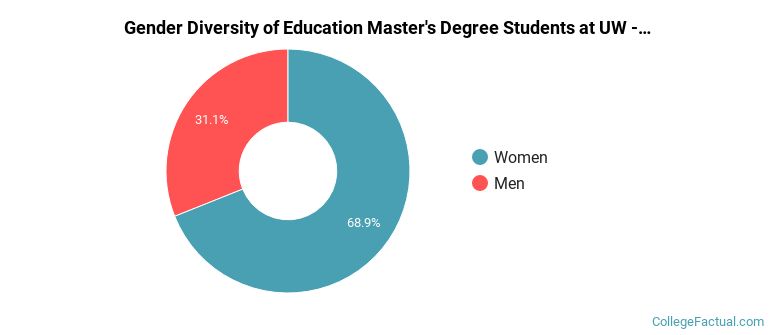
For the most recent academic year available, 31% of education master's degrees went to men and 69% went to women.
The majority of the students with this major are white. About 86% of 2022 graduates were in this category.
The following table and chart show the ethnic background for students who recently graduated from University of Wisconsin - Whitewater with a master's in education.
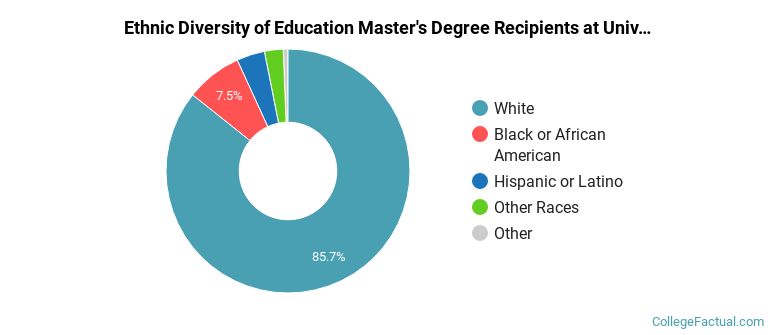
| Ethnic Background | Number of Students |
|---|---|
| Asian | 1 |
| Black or African American | 12 |
| Hispanic or Latino | 6 |
| White | 138 |
| Non-Resident Aliens | 0 |
| Other Races | 4 |
Take a look at the following statistics related to the make-up of the education majors at University of Wisconsin - Whitewater.
Education students may decide to major in one of the following focus areas. Individual majors may not be available for all degree levels.
| Major | Annual Graduates |
|---|---|
| Teacher Education Grade Specific | 242 |
| Teacher Education Subject Specific | 103 |
| Special Education | 78 |
| Student Counseling | 28 |
| Educational Administration | 23 |
| General Education | 21 |
| Other Education | 5 |
| Instructional Media Design | 2 |
More about our data sources and methodologies.