Here is an overview of this program at UVU. Degrees are awarded at the Bachelor’s level. At its best it places at #3 out of 6 schools (Bachelor’s level) by College Factual. Jump to any of the following sections:
College Factual rates UVU as a strong choice for teacher education subject specific, ranked #161 out of 554 schools nationally.
Here is each degree level available for teacher education subject specific at UVU, along with how many graduates complete each level annually.
| Degree Level | Annual Graduates |
|---|---|
| Bachelor’s | 128 |
In the most recent year for which we have data, Utah Valley University handed out 128 bachelor’s degrees in teacher education subject specific.
UVU is a solid choice among schools offering teacher education subject specific at the bachelor’s level. Its best result was #3 out of 6 schools by College Factual.
Teacher Education Subject Specific students who finish a bachelor’s at UVU report a median salary of $47,169 a year. This is below $53,268, the median for all majors at UVU.
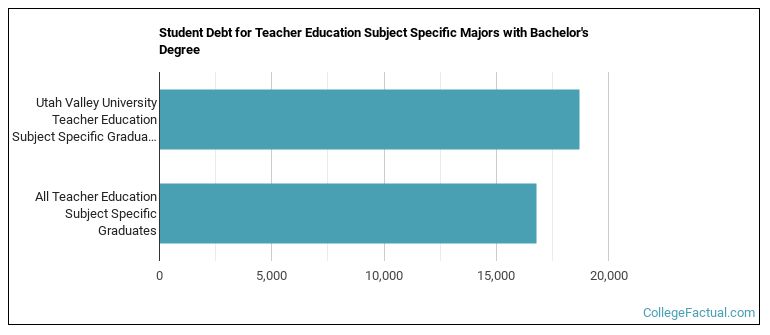
While getting their bachelor’s degree at UVU, teacher education subject specific students accumulate a median of $18,715 in student loans. This is above $16,809, the typical median for all majors at UVU.
Average full-time tuition and fees are listed in the table below.
| In State | Out of State | |
|---|---|---|
| Tuition | $5,368 | $17,800 |
| Fees | $689 | $689 |
Find out more about UVU tuition and fees.
For the most recent academic year available, 27% of teacher education subject specific bachelor’s degrees went to men and 73% went to women.
 The majority of teacher education subject specific bachelor’s degree graduates at UVU were White. Approximately 86% of graduates fell into this category.
The following table and chart show the ethnic background for students who recently graduated from Utah Valley University with a bachelor’s in teacher education subject specific.

| Ethnic Background | Number of Students |
|---|---|
| Asian | 1 |
| Black or African American | 1 |
| Hispanic or Latino | 10 |
| White | 110 |
| Non-Resident Aliens | 0 |
| Other Races | 6 |
UVU conferred 32 bachelor’s completions in history teacher education in the most recent reporting year — 62% to women and 38% to men. The largest share of these graduates were White (88%).
UVU conferred 28 bachelor’s completions in english/language arts teacher education in the latest year of data — 79% to women and 21% to men. Most of these graduates identified as White (79%).
UVU granted 23 bachelor’s degrees in health teacher education in the most recent reporting year — 87% to women and 13% to men. The largest share of these graduates were White (87%).
UVU conferred 16 bachelor’s degrees in physical education teaching and coaching in the latest year of data — 75% to women and 25% to men. The largest share of these graduates were White (88%).
UVU granted 15 bachelor’s completions in art teacher education recently — 87% to women and 13% to men. The most common background among these graduates was White (87%).
UVU conferred 6 bachelor’s completions in drama and dance teacher education recently — 100% to women and 0% to men. The most common background among these graduates was White (100%).
UVU conferred 3 bachelor’s degrees in business and innovation/entrepreneurship teacher education in the latest year of data — 0% to women and 100% to men. The most common background among these graduates was White (100%).
UVU awarded 3 bachelor’s degrees in spanish language teacher education in the most recent reporting year — 0% to women and 100% to men. Most of these graduates identified as White (67%).
UVU granted 2 bachelor’s completions in music teacher education in the most recent reporting year — 50% to women and 50% to men. The most common background among these graduates was White (100%).
