Go directly to any of the following sections:
Ranked at #6 in College Factual's most recent rankings, Villanova is in the top 1% of the country for liberal arts / sciences & humanities students pursuing a bachelor's degree. It is also ranked #1 in Pennsylvania.
| Ranking Type | Rank |
|---|---|
| Best Liberal Arts / Sciences & Humanities Schools | 6 |
| Best Liberal Arts / Sciences & Humanities Bachelor’s Degree Schools | 8 |
During the 2021-2022 academic year, Villanova University handed out 49 bachelor's degrees in liberal arts / sciences & humanities. This is an increase of 2% over the previous year when 48 degrees were handed out.
In 2022, 5 students received their master’s degree in liberal arts / sciences & humanities from Villanova. This makes it the #81 most popular school for liberal arts / sciences & humanities master’s degree candidates in the country.
Learn about other programs related to Liberal Arts / Sciences & Humanities that might interest you.
Maximize your transfer credits and complete your bachelor's degree faster with this flexible online bachelor's from Southern New Hampshire University.
During the 2022-2023 academic year, part-time undergraduate students at Villanova paid an average of $1,010 per credit hour. No discount was available for in-state students. The following table shows the average full-time tuition and fees for undergraduates.
| In State | Out of State | |
|---|---|---|
| Tuition | $63,806 | $63,806 |
| Fees | $895 | $895 |
| Books and Supplies | $1,100 | $1,100 |
| On Campus Room and Board | $16,896 | $16,896 |
| On Campus Other Expenses | $2,300 | $2,300 |
Learn more about Villanova tuition and fees.
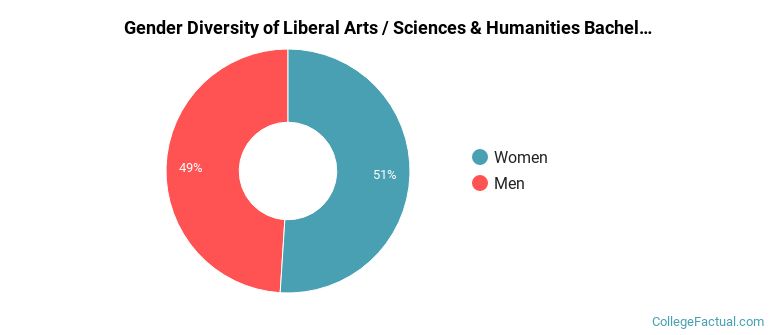
During the 2021-2022 academic year, 49 liberal arts / sciences & humanities majors earned their bachelor's degree from Villanova. Of these graduates, 49% were men and 51% were women.
The majority of bachelor's degree recipients in this major at Villanova are white. In the most recent graduating class for which data is available, 73% of students fell into this category.
The following table and chart show the ethnic background for students who recently graduated from Villanova University with a bachelor's in liberal arts / sciences & humanities.
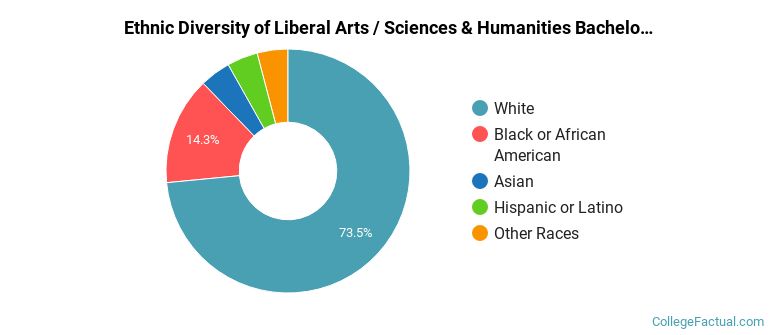
| Ethnic Background | Number of Students |
|---|---|
| Asian | 2 |
| Black or African American | 7 |
| Hispanic or Latino | 2 |
| White | 36 |
| Non-Resident Aliens | 0 |
| Other Races | 2 |
Villanova does not offer an online option for its liberal arts / sciences & humanities bachelor’s degree program at this time. To see if the school offers distance learning options in other areas, visit the Villanova Online Learning page.
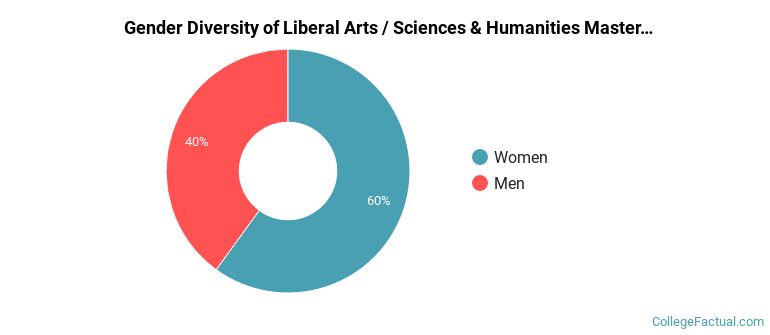
Of the 5 students who earned a master's degree in Liberal Arts / Sciences & Humanities from Villanova in 2021-2022, 40% were men and 60% were women.
The majority of the students with this major are white. About 80% of 2022 graduates were in this category.
The following table and chart show the ethnic background for students who recently graduated from Villanova University with a master's in liberal arts / sciences & humanities.
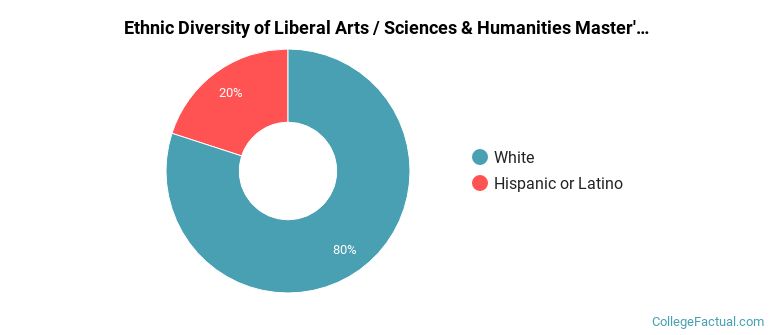
| Ethnic Background | Number of Students |
|---|---|
| Asian | 0 |
| Black or African American | 0 |
| Hispanic or Latino | 1 |
| White | 4 |
| Non-Resident Aliens | 0 |
| Other Races | 0 |
Take a look at the following statistics related to the make-up of the liberal arts / sciences & humanities majors at Villanova University.
Liberal Arts / Sciences & Humanities students may decide to major in one of the following focus areas. Individual majors may not be available for all degree levels.
| Major | Annual Graduates |
|---|---|
| Liberal Arts General Studies | 54 |
| Related Major | Annual Graduates |
|---|---|
| Social Sciences | 303 |
| Communication & Journalism | 181 |
| Foreign Languages & Linguistics | 50 |
| Theology & Religious Vocations | 44 |
| English Language & Literature | 34 |
View All Liberal Arts / Sciences & Humanities Related Majors >
More about our data sources and methodologies.
