We've gathered data and other essential information about the program, such as the ethnicity of students, how many students graduated in recent times, and more. In addition, we cover how Wade College ranks in comparison to other schools with design programs.
Jump to any of the following sections:
Learn about start dates, transferring credits, availability of financial aid, and more by contacting the universities below.
BA in Graphic Design & Media Arts
Translate your creative ideas through concept, design and digital media with a bachelor's in graphic design online from Southern New Hampshire University.
Take the first step toward a career of visual expression and doing what you love with this online associate degree from Southern New Hampshire University.
Learn to create a striking portfolio and hone the skills you need to succeed in the world of professional photography with this online digital photography degree from Southern New Hampshire University.
The design major at Wade College is not ranked on College Factual’s Best Colleges and Universities for Design & Applied Arts. This could be for a number of reasons, such as not having enough data on the major or school to make an accurate assessment of its quality.
During the 2021-2022 academic year, Wade College handed out 6 bachelor's degrees in design & applied arts. This is a decrease of 45% over the previous year when 11 degrees were handed out.
Learn about other programs related to Design & Applied Arts that might interest you.
Get on the right path to the fast-paced, exciting world of video game art and design with this online bachelor's from Southern New Hampshire University.
BA in Graphic Design & Media Arts - Web Design
Gain a solid grounding in your online web design classes and exercise your creative muscle with this specialized online bachelor's from Southern New Hampshire University.
In 2022-2023, the average part-time undergraduate tuition at Wade College was $737 per credit hour for both in-state and out-of-state students. The average full-time tuition and fees for undergraduates are shown in the table below.
| In State | Out of State | |
|---|---|---|
| Tuition | $17,680 | $17,680 |
Learn more about Wade College tuition and fees.
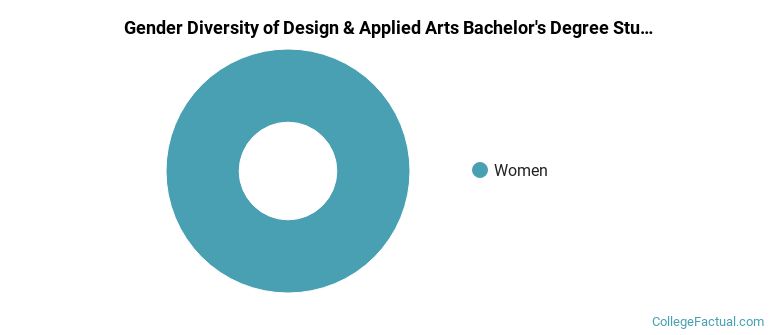
All of the 6 students who graduated with a Bachelor’s in design from Wade College in 2022 were women.
The following table and chart show the ethnic background for students who recently graduated from Wade College with a bachelor's in design.
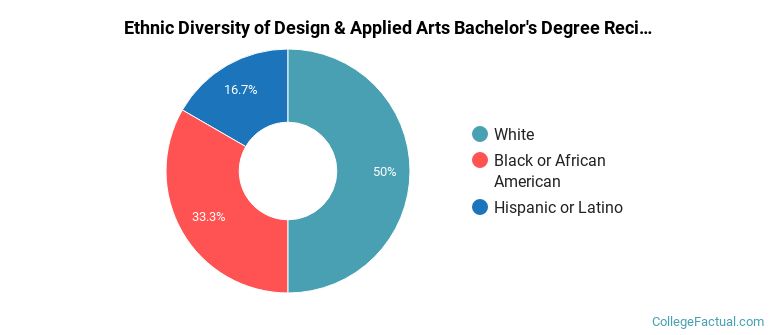
| Ethnic Background | Number of Students |
|---|---|
| Asian | 0 |
| Black or African American | 2 |
| Hispanic or Latino | 1 |
| White | 3 |
| Non-Resident Aliens | 0 |
| Other Races | 0 |
Wade College does not offer an online option for its design bachelor’s degree program at this time. To see if the school offers distance learning options in other areas, visit the Wade College Online Learning page.
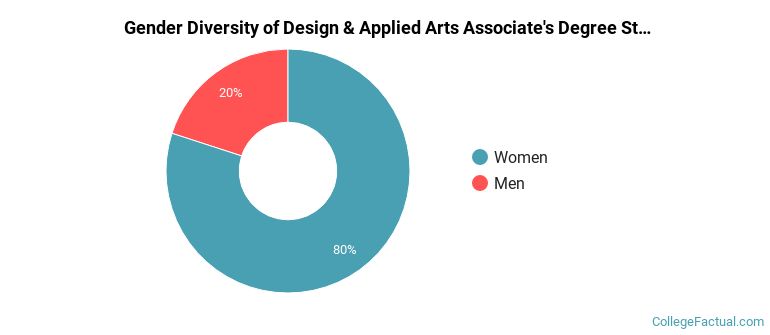
The design program at Wade College awarded 15 associate's degrees in 2021-2022. About 20% of these degrees went to men with the other 80% going to women.
The following table and chart show the ethnic background for students who recently graduated from Wade College with a associate's in design.
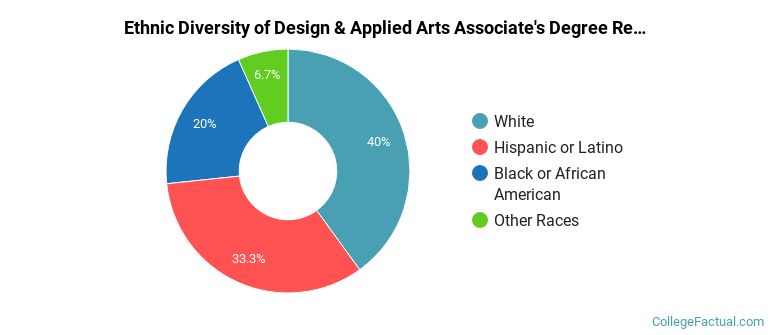
| Ethnic Background | Number of Students |
|---|---|
| Asian | 0 |
| Black or African American | 3 |
| Hispanic or Latino | 5 |
| White | 6 |
| Non-Resident Aliens | 0 |
| Other Races | 1 |
Take a look at the following statistics related to the make-up of the design majors at Wade College.
