Go directly to any of the following sections:
The bachelor's program at Waldorf was ranked #1,169 on College Factual's Best Schools for health professions list. It is also ranked #16 in Iowa.
During the 2021-2022 academic year, Waldorf University handed out 42 bachelor's degrees in health professions. This is an increase of 5% over the previous year when 40 degrees were handed out.
In 2022, 15 students received their master’s degree in health professions from Waldorf. This makes it the #947 most popular school for health professions master’s degree candidates in the country.
Part-time undergraduates at Waldorf paid an average of $332 per credit hour in 2022-2023. This tuition was the same for both in-state and out-of-state students. Information about average full-time undergraduate tuition and fees is shown in the table below.
| In State | Out of State | |
|---|---|---|
| Tuition | $23,800 | $23,800 |
| Fees | $1,420 | $1,420 |
| Books and Supplies | $1,578 | $1,578 |
| On Campus Room and Board | $9,448 | $9,448 |
| On Campus Other Expenses | $3,720 | $3,720 |
Learn more about Waldorf tuition and fees.
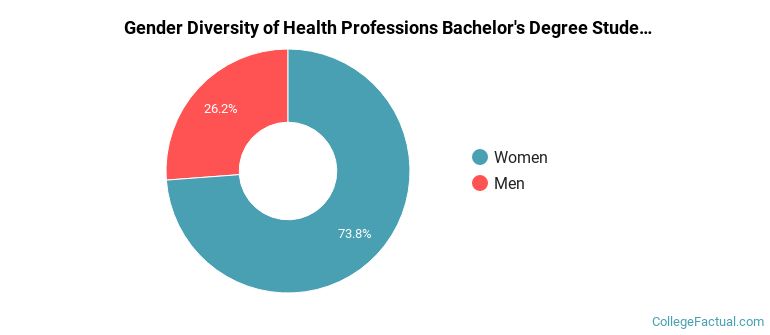
During the 2021-2022 academic year, 42 health professions majors earned their bachelor's degree from Waldorf. Of these graduates, 26% were men and 74% were women.
The following table and chart show the ethnic background for students who recently graduated from Waldorf University with a bachelor's in health professions.
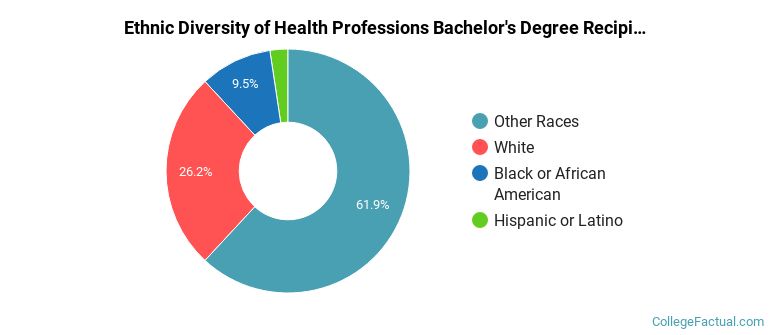
| Ethnic Background | Number of Students |
|---|---|
| Asian | 0 |
| Black or African American | 4 |
| Hispanic or Latino | 1 |
| White | 11 |
| Non-Resident Aliens | 0 |
| Other Races | 26 |
If you’re one of the many students who want the flexibility of distance learning courses, you’ll be happy to hear that Waldorf offers online option in its health professions bachelor’s degree program. To see if the school offers distance learning options in other areas, visit the Waldorf Online Learning page.
In the 2021-2022 academic year, 17 students earned a master's degree in health professions from Waldorf. About 71% of these graduates were women and the other 29% were men.

The following table and chart show the ethnic background for students who recently graduated from Waldorf University with a master's in health professions.
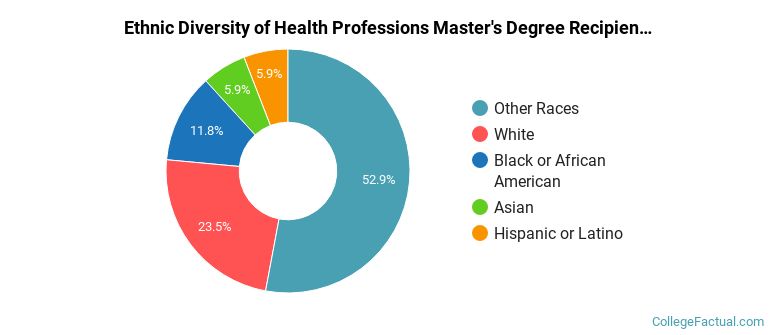
| Ethnic Background | Number of Students |
|---|---|
| Asian | 1 |
| Black or African American | 2 |
| Hispanic or Latino | 1 |
| White | 4 |
| Non-Resident Aliens | 0 |
| Other Races | 9 |
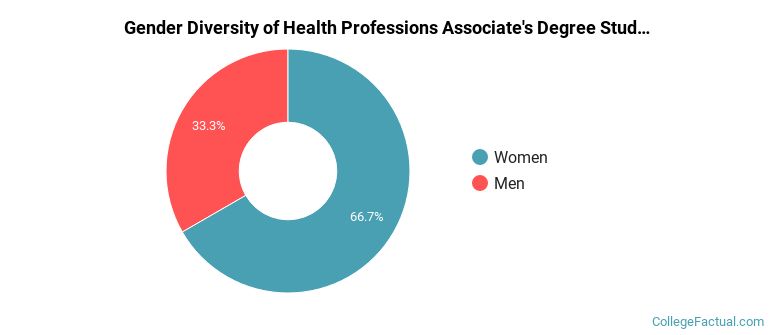
Of the 6 students who graduated with a Associate’s in health professions from Waldorf in 2022, 33% were men and 67% were women.
The following table and chart show the ethnic background for students who recently graduated from Waldorf University with a associate's in health professions.
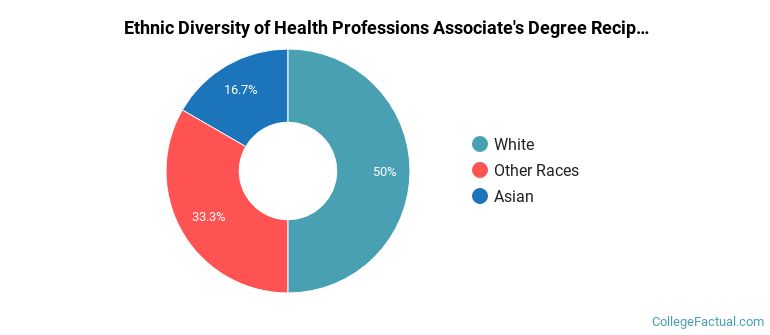
| Ethnic Background | Number of Students |
|---|---|
| Asian | 1 |
| Black or African American | 0 |
| Hispanic or Latino | 0 |
| White | 3 |
| Non-Resident Aliens | 0 |
| Other Races | 2 |
Take a look at the following statistics related to the make-up of the health professions majors at Waldorf University.
Health Professions students may decide to major in one of the following focus areas. Individual majors may not be available for all degree levels.
| Major | Annual Graduates |
|---|---|
| Health & Medical Administrative Services | 65 |