We've gathered data and other essential information about the program, such as the ethnicity of students, how many students graduated in recent times, and more. We've also included details on how WGU ranks compared to other colleges offering a major in grade specific ed.
Go directly to any of the following sections:
WGU was ranked #89 on College Factual's most recent list of the best schools for grade specific ed majors. This puts the bachelor's program at the school solidly in the top 15% of all colleges and universities in the country. It is also ranked #2 in Utah.
During the 2021-2022 academic year, Western Governors University handed out 1802 bachelor's degrees in teacher education grade specific. This is a decrease of 1% over the previous year when 1,819 degrees were handed out.
In 2022, 603 students received their master’s degree in grade specific ed from WGU. This makes it the #3 most popular school for grade specific ed master’s degree candidates in the country.
The following table shows the average full-time tuition and fees for undergraduates.
| In State | Out of State | |
|---|---|---|
| Tuition | $7,710 | $7,710 |
| Fees | $590 | $590 |
| Books and Supplies | $200 | $200 |
Learn more about WGU tuition and fees.
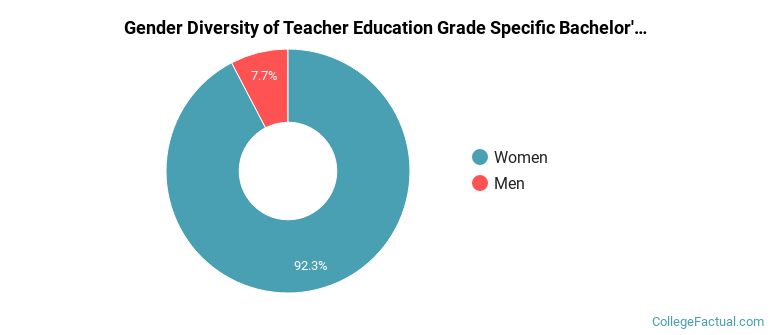
During the 2021-2022 academic year, 1,802 students graduated with a bachelor's degree in grade specific ed from WGU. About 8% were men and 92% were women.
The majority of the students with this major are white. About 78% of 2022 graduates were in this category.
The following table and chart show the ethnic background for students who recently graduated from Western Governors University with a bachelor's in grade specific ed.
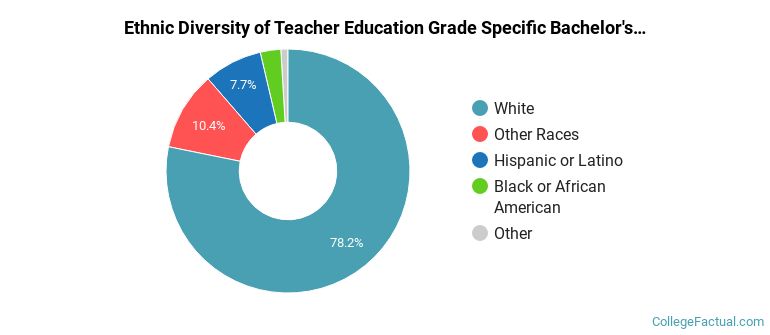
| Ethnic Background | Number of Students |
|---|---|
| Asian | 17 |
| Black or African American | 49 |
| Hispanic or Latino | 139 |
| White | 1,409 |
| Non-Resident Aliens | 0 |
| Other Races | 188 |
Online degrees for the WGU grade specific ed bachelor’s degree program are not available at this time. To see if the school offers distance learning options in other areas, visit the WGU Online Learning page.
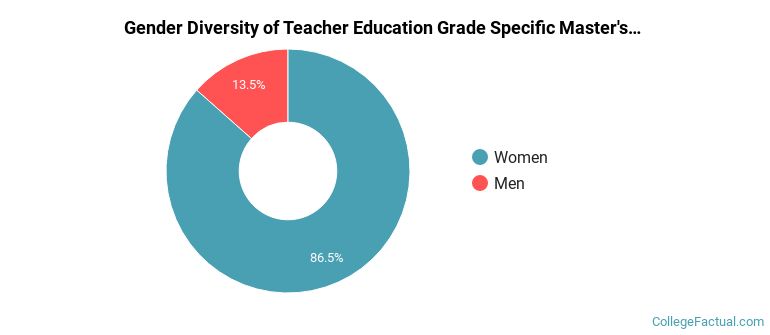
Of the 1,010 students who earned a master's degree in Teacher Education Grade Specific from WGU in 2021-2022, 13% were men and 87% were women.
The majority of the students with this major are white. About 70% of 2022 graduates were in this category.
The following table and chart show the ethnic background for students who recently graduated from Western Governors University with a master's in grade specific ed.
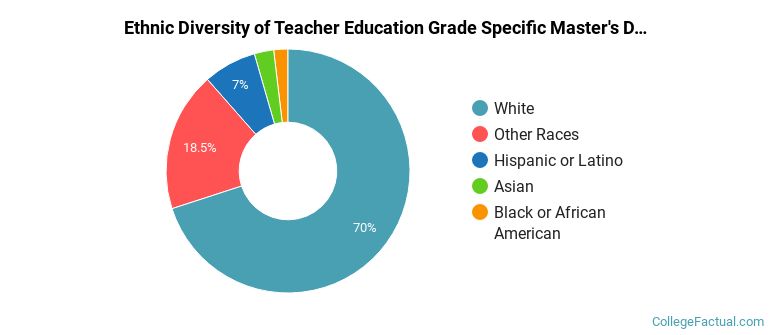
| Ethnic Background | Number of Students |
|---|---|
| Asian | 26 |
| Black or African American | 19 |
| Hispanic or Latino | 71 |
| White | 707 |
| Non-Resident Aliens | 0 |
| Other Races | 187 |
Take a look at the following statistics related to the make-up of the grade specific ed majors at Western Governors University.
| Related Major | Annual Graduates |
|---|---|
| Curriculum & Instruction | 2,461 |
| Instructional Media Design | 1,962 |
| Educational Assessment | 1,843 |
| Teacher Education Subject Specific | 1,541 |
| Special Education | 924 |