Jump to any of the following sections:
The bachelor's program at WKU was ranked #402 on College Factual's Best Schools for social sciences list. It is also ranked #4 in Kentucky.
| Ranking Type | Rank |
|---|---|
| Best Social Sciences Bachelor’s Degree Schools | 384 |
| Best Social Sciences Schools | 402 |
During the 2021-2022 academic year, Western Kentucky University handed out 257 bachelor's degrees in social sciences. This is a decrease of 6% over the previous year when 273 degrees were handed out.
In 2022, 20 students received their master’s degree in social sciences from WKU. This makes it the #201 most popular school for social sciences master’s degree candidates in the country.
In 2022-2023, the average part-time undergraduate tuition at WKU was $1,125 per credit hour for out-of-state students. The average for in-state students was $477 per credit hour. Information about average full-time undergraduate tuition and fees is shown in the table below.
| In State | Out of State | |
|---|---|---|
| Tuition | $11,436 | $27,000 |
| Books and Supplies | $1,000 | $1,000 |
| On Campus Room and Board | $12,043 | $12,043 |
| On Campus Other Expenses | $2,409 | $2,409 |
Learn more about WKU tuition and fees.
During the 2021-2022 academic year, 257 students graduated with a bachelor's degree in social sciences from WKU. About 45% were men and 55% were women.

The majority of the students with this major are white. About 82% of 2022 graduates were in this category.
The following table and chart show the ethnic background for students who recently graduated from Western Kentucky University with a bachelor's in social sciences.
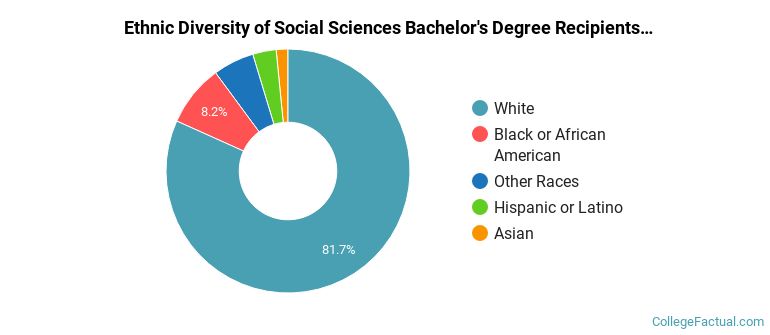
| Ethnic Background | Number of Students |
|---|---|
| Asian | 4 |
| Black or African American | 21 |
| Hispanic or Latino | 8 |
| White | 210 |
| Non-Resident Aliens | 0 |
| Other Races | 14 |
If you’re one of the many students who want the flexibility of distance learning courses, you’ll be happy to hear that WKU offers online option in its social sciences bachelor’s degree program. To see if the school offers distance learning options in other areas, visit the WKU Online Learning page.
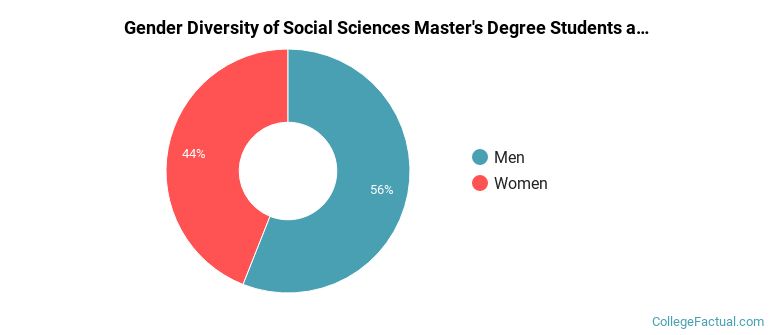
Of the 25 students who earned a master's degree in Social Sciences from WKU in 2021-2022, 56% were men and 44% were women.
The majority of the students with this major are white. About 76% of 2022 graduates were in this category.
The following table and chart show the ethnic background for students who recently graduated from Western Kentucky University with a master's in social sciences.

| Ethnic Background | Number of Students |
|---|---|
| Asian | 0 |
| Black or African American | 0 |
| Hispanic or Latino | 2 |
| White | 19 |
| Non-Resident Aliens | 2 |
| Other Races | 2 |
Take a look at the following statistics related to the make-up of the social sciences majors at Western Kentucky University.
Social Sciences students may decide to major in one of the following focus areas. Individual majors may not be available for all degree levels.
| Major | Annual Graduates |
|---|---|
| Economics | 51 |
| Geography & Cartography | 42 |
| Political Science & Government | 41 |
| Sociology | 40 |
| International Relations & National Security | 15 |
| Anthropology | 13 |
| General Social Sciences | 11 |
| Related Major | Annual Graduates |
|---|---|
| Communication & Journalism | 267 |
| Liberal Arts / Sciences & Humanities | 178 |
| Family, Consumer & Human Sciences | 66 |
| English Language & Literature | 56 |
| Foreign Languages & Linguistics | 35 |
More about our data sources and methodologies.