Here, you'll find out more about the major, including such details as the number of graduates, what degree levels are offered, ethnicity of students, and more. Also, learn how WWCC ranks among other schools offering degrees in political science.
Go directly to any of the following sections:
Learn about start dates, transferring credits, availability of financial aid, and more by contacting the universities below.
Gain a solid understanding of American political history, the current political landscape, and the major political parties with this online bachelor's from Southern New Hampshire University.
The political science major at WWCC is not ranked on College Factual’s Best Colleges and Universities for Political Science & Government. This could be for a number of reasons, such as not having enough data on the major or school to make an accurate assessment of its quality.
Out-of-state part-time undergraduates at WWCC paid an average of $315 per credit hour in 2022-2023. The average for in-state students was $105 per credit hour. The following table shows the average full-time tuition and fees for undergraduates.
| In State | Out of State | |
|---|---|---|
| Tuition | $3,150 | $9,450 |
| Fees | $1,100 | $1,100 |
| Books and Supplies | $1,500 | $1,500 |
| On Campus Room and Board | $8,710 | $8,710 |
| On Campus Other Expenses | $2,400 | $2,400 |
Learn more about WWCC tuition and fees.
WWCC does not offer an online option for its political science bachelor’s degree program at this time. To see if the school offers distance learning options in other areas, visit the WWCC Online Learning page.
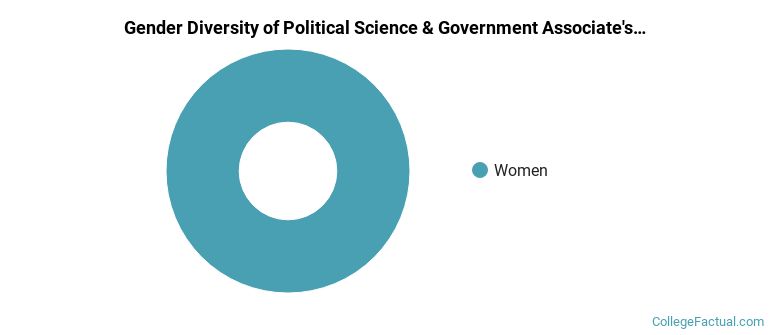
All of the 1 students who graduated with a Associate’s in political science from WWCC in 2022 were women.
The following table and chart show the ethnic background for students who recently graduated from Western Wyoming Community College with a associate's in political science.

| Ethnic Background | Number of Students |
|---|---|
| Asian | 0 |
| Black or African American | 0 |
| Hispanic or Latino | 0 |
| White | 0 |
| Non-Resident Aliens | 1 |
| Other Races | 0 |
| Related Major | Annual Graduates |
|---|---|
| General Social Sciences | 1 |
| Sociology | 1 |
