In its yearly rankings, College Factual analyzes over 2,000 colleges and universities to determine which ones are the best in a variety of categories, such as overall value, quality, diversity, which schools are the best for each major, and much more.
Whitworth University was awarded 12 badges in the 2025 rankings. The highest ranked major at the school is montessori teacher education.
Explore the best ranked schools for the programs you are most interested in.
Whitworth landed the #922 spot in College Factual's 2025 ranking of best overall colleges in the United States. The higher ed experts analyzed 2,152 colleges and universities across the nation to determine this ranking.
Whitworth is also ranked #18 out of 50 schools in Washington.
Whitworth University has an acceptance rate of 91%, so it is easier to gain admission to this school than some others. Still, the admissions staff will examine your application closely to make sure you're a good fit for Whitworth.
About 30% of students accepted to Whitworth submitted their SAT scores. When looking at the 25th through the 75th percentile, SAT Evidence-Based Reading and Writing scores ranged between 570 and 690. Math scores were between 540 and 660.
The student to faculty ratio at Whitworth is an impressive 10 to 1. That's quite good when you compare it to the national average of 15 to 1. This is a good sign that students at the school will have more opportunities for one-on-one interactions with their professors.
When estimating how much access students will have to their teachers, some people like to look at what percentage of faculty members are full time. This is because part-time teachers may not have as much time to spend on campus as their full-time counterparts.
The full-time faculty percentage at Whitworth University is 100%. This is higher than the national average of 47%.
Whitworth University has a freshmen retention rate of 78%. That's a good sign that full-time students like the school and their professors enough to want to stick around for another year. It's also a sign that the admissions team did a good job in choosing applicants who were a good fit for the school.
The on-time graduation rate for someone pursuing a bachelor's degree is typically four years. This rate at Whitworth for first-time, full-time students is 66%, which is better than the national average of 33.3%.
Find out more about the retention and graduation rates at Whitworth University.
During the 2017-2018 academic year, there were 2,368 undergraduates at Whitworth with 2,307 being full-time and 61 being part-time.
| $0-30 K | $30K-48K | $48-75 | $75-110K | $110K + |
|---|---|---|---|---|
| $16,783 | $17,475 | $22,203 | $34,315 | $34,116 |
The net price is calculated by adding tuition, room, board and other costs and subtracting financial aid.Note that the net price is typically less than the published for a school. For more information on the sticker price of Whitworth, see our tuition and fees and room and board pages.
While almost two-thirds of students nationwide take out loans to pay for college, the percentage may be quite different for the school you plan on attending. At Whitworth, approximately 60% of students took out student loans averaging $7,905 a year. That adds up to $31,620 over four years for those students.
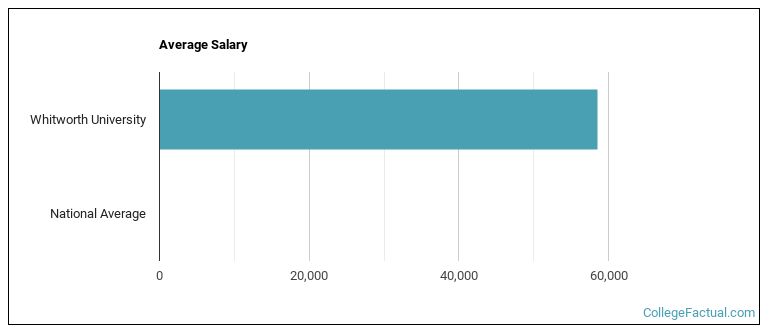
See which majors at Whitworth University make the most money.
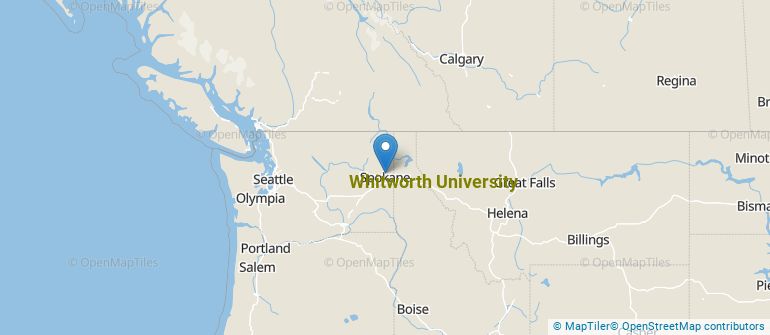
Get more details about the location of Whitworth University.
Contact details for Whitworth are given below.
| Contact Details | |
|---|---|
| Address: | 300 W Hawthorne Rd, Spokane, WA 99251 |
| Phone: | 509-777-1000 |
| Website: | www.whitworth.edu/ |
| Most Popular Majors | Bachelor’s Degrees | Average Salary of Graduates |
|---|---|---|
| Teacher Education Grade Specific | 114 | $42,846 |
| Business Administration & Management | 71 | $47,241 |
| General Psychology | 57 | $29,005 |
| Biological & Physical Science | 55 | $34,703 |
| Sociology | 34 | $32,727 |
| Chemistry | 32 | $33,203 |
| Computer Science | 28 | $62,139 |
| General Biology | 27 | $29,599 |
| Nursing | 27 | $78,417 |
| Economics | 27 | $63,134 |
Online courses area a great option for busy, working students as well as for those who have scheduling conflicts and want to study on their own time. As time goes by, expect to see more and more online learning options become available.
In 2022-2023, 152 students took at least one online class at Whitworth University. This is a decrease from the 264 students who took online classes the previous year.
| Year | Took at Least One Online Class | Took All Classes Online |
|---|---|---|
| 2022-2023 | 152 | 57 |
| 2021-2022 | 264 | 24 |
| 2020-2021 | 351 | 236 |
| 2018-2019 | 87 | 49 |
Footnotes
*The racial-ethnic minorities count is calculated by taking the total number of students and subtracting white students, international students, and students whose race/ethnicity was unknown. This number is then divided by the total number of students at the school to obtain the racial-ethnic minorities percentage.
References
More about our data sources and methodologies.